Chartist.js is a simple responsive charting library built with SVG. Chartist’s goal is to provide a simple, lightweight and non-intrusive library to responsive craft charts on your website. It’s important to understand that one of the main intentions of Chartist.js is to rely on standards rather than providing a own solution to the problem which is is already solved by the standard.
Chartist works with inline-SVG and therefore leverages the power of the DOM to provide parts of its functionality. This also means that Chartist is not providing it’s own event handling, labels, behaviors and anything else that can just be done with plain HTML, JavaScript and CSS.

Requirements: JavaScript Framework
Demo: http://gionkunz.github.io/chartist-js/
License: License Free
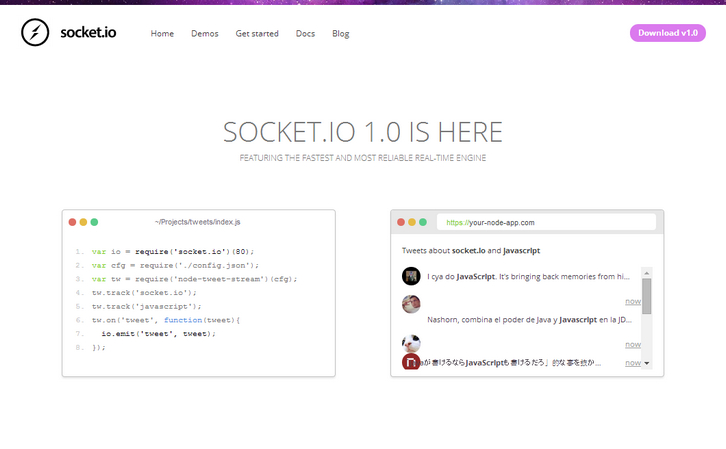
Socket.IO enables real-time bidirectional event-based communication. It works on every platform, browser or device, focusing equally on reliability and speed. You can push data to clients that gets represented as real-time counters, charts or logs.
Starting in 1.0, it’s possible to send any blob back and forth: image, audio, video. And it allows users to concurrently edit a document and see each other’s changes. It’s one of the most powerful JavaScript frameworks on GitHub, and most depended-upon NPM module.
Requirements: JavaScript Framework
Demo: http://socket.io/
License: MIT License
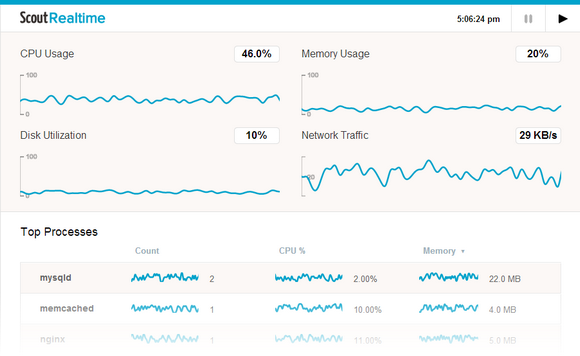
Scout Realtime is a better top command: it gives you disk, memory, network, CPU, and process metrics. And it gives you smooth-flowing charts for everything. Troubleshooting is so much easier when you can see a few minutes worth of realtime data instead of watching individual numbers flash on your terminal window.
You need Ruby 1.9.3+ on your server to run scout_realtime. And you need a public IP or domain name to view scout_realtime in your browser.
Requirements: Ruby 1.9.3+
Demo: http://scoutapp.github.io/scout_realtime/
License: MIT License
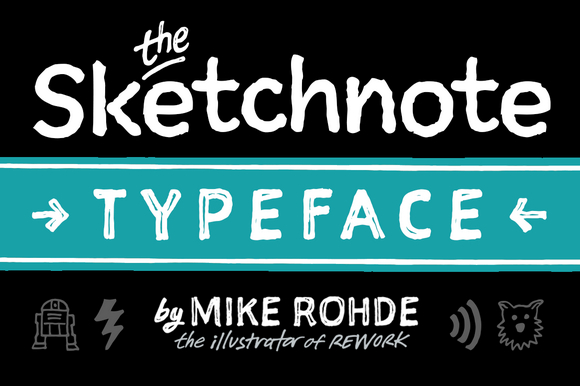
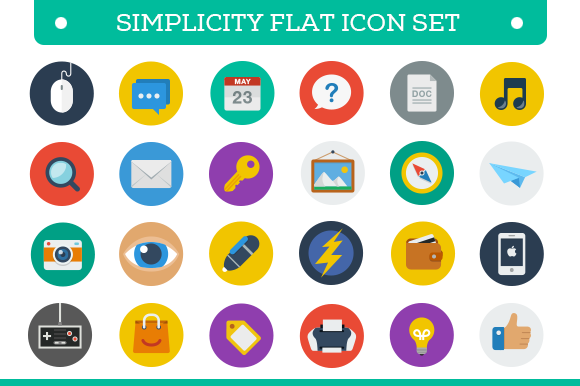
Creative Market is a platform for handcrafted, mousemade design content from independent creatives around the world. It helps creatives easily access a wealth of beautiful design content for their projects. Whether it’s finding a unique vector pattern for a textile, the perfect font with personality for a new logo, or any other kind of digital creative content that helps you produce something amazing.
Creative Market is currently running a Black Friday Promotion, you can get 20% off your next purchase until midnight of 2nd with this Coupon link. In order to help you, we have selected the following great creative products you can take a look at.

Read the rest of this entry »
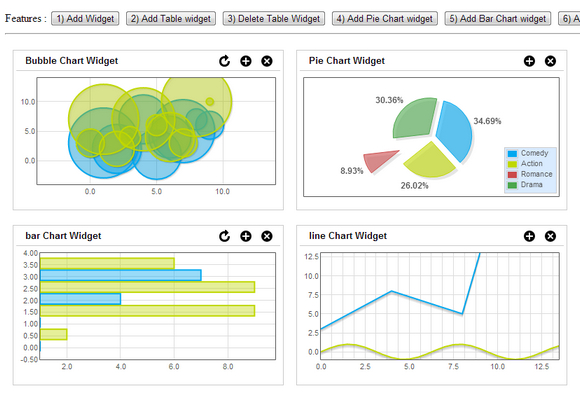
sDashboard is a simple & light weight dashboard jQuery plugin that converts an array of objects into a dashboard. Each object in the array would be rendered as a dashboard widget that can be rearranged by dragging around.
sDashboards has built in support for rendering datatable’s and flotr2 charts. It also has support to listen for events such as table row click, chart data click and data selection built-in. sDashboard depends on the following libraries: jQuery, jQuery UI, Datatables and Flotr2 charts (required for charting widgets).
Requirements: jQuery Framework
Demo: http://modeln.github.io/sDashboard/
License: MIT License
Pizza Pie Charts is a responsive Pie chart based on the Snap SVG framework from Adobe. It focuses on easy integration via HTML markup and CSS instead of JavaScript objects, although you can pass JavaScript objects to Pizza as well.
You can deliver pie charts to any device with Pizza. Your pie will be steaming hot with SVG so that it looks good on retina devices and HiDPI devices. And the pie will fit the width of your box — um, container — or can be given a max-width or max-height.

Requirements: Sass Framework
Demo: http://zurb.com/playground/pizza-pie-charts
License: MIT License
The Web began as markup only, and then some script and styling. For many developers, especially us veterans, it’s hard to imagine a Web without plug-ins. Since the earliest days, browser plug-ins like Flash and ActiveX have been the main way to create rich online experiences for more sophisticated Web experiences.
And yet through the efforts of the industry and community, we have returned to a plug-in free Web once again. Much Web browsing today occurs on smart phones and tablets have limited or no support plug-in. Modern browsers like Chrome, Firefox, and Internet Explorer 10/9 have embraced and implemented Web standards like HTML5, CSS3, and JavaScript which, in most cases, now reach feature parity with plug-ins (more on those differences later) and are more interoperable across browsers. With more than 75% of all browsers in North America now compatible with HTML5, market researcher Forrester recently said it’s time to say “so long” to plug-in. “The tide,” pronounced Forrester analyst Peter Sheldon, “is turning.”

How the heck did we get here? And, more importantly, where are — where should — we be going?
In this six-part series, we’ll take a hands-on look at the evolution of the Web to what many (including me) see as a shift toward plug-in free. I’ll focus on common Web experiences that have already been written with a plug-in and show you how to convert, and enhance them with HTML5. Read the rest of this entry »
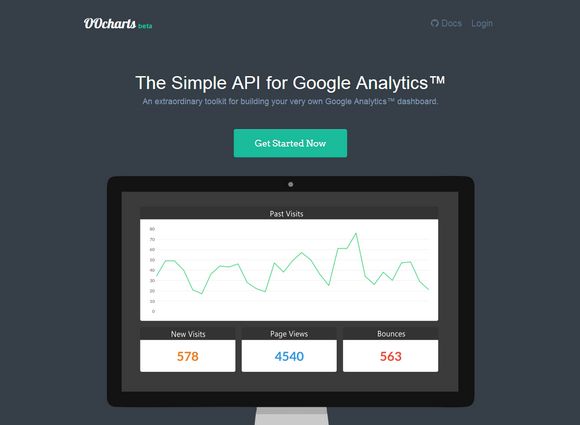
OOcharts is the Simple API for Google Analytics. It is an awesome little project that makes it easy to embed and share Google Analytics data through charts. API Keys are created to give access to certain Google Analytics profiles. For every request to OOcharts, you will need a valid API Key.
They queue your requests that would normally exceed the Google Analyticsâ„¢ API limits to ensure you get your data fast and reliably. They also cache requests so you don’t have to waste time waiting for the same report you asked for a couple seconds ago. As soon as you connect your Googleâ„¢ profile and make an API Key for your site, you can start getting data. You can fork OOcharts on Github too.
Requirements: JavaScript Enabled
Demo: http://oocharts.com/
License: License Free
As a designer, sometimes it’s difficult to get started on a new project. Maybe You will need to scour the web for inspiration, or doodle on a notepad to hopefully get some ideas. That’s when you need to look through collections of freebies.
Fortunately, enhancing your web design doesn’t have to cost a small fortune or take a lot of time. Here are 10 Awesome Freebies for Designers that can help enhance your web presence today.
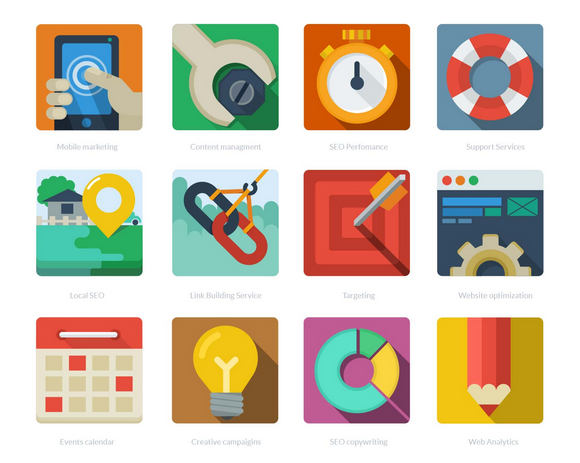
1. Flat SEO icons
This set of 12 flat SEO icons is perfect for adding a light-hearted and playful tone to sites. The flat aesthetic is set off beautifully by the modern color palette and the addition of the long shadow technique is a sophisticated touch. Playful and approachable, the icons are useful for a number of different industries.
2. Colorful Grunge Textures
The pack contains 25 .jpg textures at 5000 by 5000px saved at 300ppi. The textures are compatible with all photo editors that support layers (Photoshop, Photoshop Elements, GIMP, Pixelmator etc.), both PC and Mac.

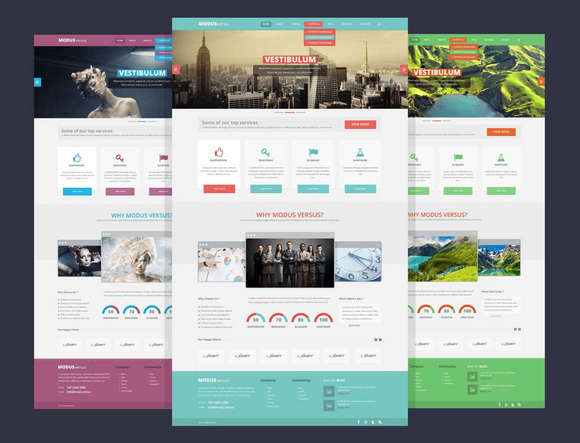
3. Modus Versus PSD Template
Modus Versus is a free multi-purpose PSD template, designed on the 1170 grid system. Excellent for use with responsive frameworks like the popular Twitter Bootstrap, it could form the basis of a good corporate site.
Read the rest of this entry »
In this article, I’ll introduce you to Fabric.js—a powerful JavaScript library that makes working with the HTML5 canvas element a breeze. Fabric provides a missing object model for canvas, as well as an SVG parser, a layer of interactivity, and a whole suite of other indispensable tools. It is a fully open-source project, licensed under MIT, with many contributions over the years.
I started developing with Fabric three years ago after discovering the pains of working with the native canvas API. I was creating an interactive design editor for printio.ru—my startup that allows users to design their own apparel. The kind of interactivity I wanted existed only in Flash apps in those days. Now, very few libraries come close to what is possible with Fabric, so let’s take a closer look.
Why Fabric?
Canvas allows you to create some absolutely amazing graphics on the Web these days, but the API it provides is disappointingly low level. It’s one thing if you simply want to draw a few basic shapes on a canvas and forget about them. If you need any kind of interaction, to change a picture at any point, or to draw more complex shapes, the situation changes dramatically. Fabric aims to solve this problem.

Native canvas methods allow you only to fire off simple graphic commands, blindly modifying the entire canvas bitmap. Do you want to draw a rectangle? Use fillRect(left, top, width, height). Want to draw a line? Use a combination of moveTo(left, top) and lineTo(x, y). It’s as if you’re painting a canvas with a brush, layering more and more oil or acrylic on top, with very little control. Read the rest of this entry »


