SlickPlan is a web-based sitemap/flowchart generator that allows for the creation of free sitemap and flowchart design quickly and easily. SlickPlan is ideal for web designers and developers who need to create navigation flowcharts for their clients. Although SlickPlan is perfect for professionals, its simplicity allows anyone who needs a basic flowchart to use it.
Creating an account enables you to keep your sitemaps neatly organized on SlickPlan’s website. That way, you don’t have to keep track of them yourself. Your sitemaps will be right in front of you when you sign in.

Requirements: –
Demo: http://www.slickplan.com/
License: License Free
Axiis is an open source data visualization framework designed for beginner and expert developers alike. Axiis gives developers the ability to expressively define their data visualizations through concise and intuitive markup.
Axiis provides both pre-built visualization components as well as abstract layout patterns and rendering classes that allow you to create your own unique visualizations. Axiis was designed to be a granular framework, allowing developers to mix and match components and build complex output by compositing together basic building blocks.
Axiis is an open source project, under an MIT license. This means you can use it for personal projects, commercial work, and pretty much anything you can think of with no restrictions.
Requirements: Degrafa Graphics Framework & Adobe Flex 3
Demo: http://www.axiis.org/examples.html
License: MIT License

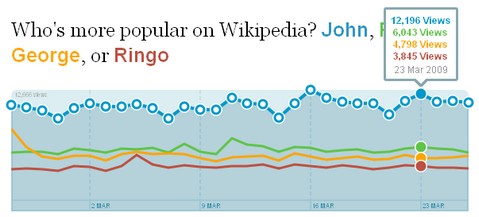
Wikirank shows you what people are reading on Wikipedia. It’s based on the actual usage data from the Wikipedia servers, which the Wikimedia foundation makes available as a public service. They take that data, process it, and give it back to you in a format that’s easy to use and share. Wikirank reveals emerging trends, and lets you embed relevant charts in blog posts and on social media sites.
From a technical perspective, the charts on Wikirank are based on logs from Wikipedia’s HTTP Squid proxy servers. That means every single page load is recorded, whether initiated by a human with a browser or a Web spider crawling through. Therefore, the numbers for a topic on a particular day can’t be considered absolute impressions the way, say, an ad server might count them.
The data of Wikirank indicates relative increases or decreases, so the shape of the charts is more important than the specific number of views. Comparisons are even more interesting, as relative interest in multiple topics can be ranked.
Requirements: –
Demo: http://wikirank.com
License: GFDL License
pChart is a PHP class oriented framework designed to create aliased charts. Most of todays chart libraries have a cost, pChart is intended to be free. Data can be retrieved from SQL queries, CSV files, or manually provided. Focus has been put on rendering quality introducing an aliasing algorithm to draw eye candy graphics. This project is still under development and new features or fix are made every week.


Requirements: PHP
Demo: http://pchart.sourceforge.net/demo.php
License: GPL License
Yahoo! Design Stencil Kit version 1.0 is available for OmniGraffle, Visio (XML), Adobe Illustrator (PDF and SVG), and Adobe Photoshop (PNG), and covers the following topics:
- Ad Units
- Calendars
- Carousels
- Charts and Tables
- UI Controls
- Form Elements
- Grids
- Menus and Buttons
- Mobile – General
- Mobile – iPhone
- Navigation and Pagination
- OS Elements
- Placeholder Text
- Screen Resolutions
- Tabs
- Windows and Containers

I am sure you will find them useful when designing user interface for your website / web application. All of them are licensed under a Creative Commons Attribution 2.5 License.
Requirements: –
Demo: http://developer.yahoo.com/ypatterns/wireframes/
License: Creative Commons 2.5 License
Google Doctype is an open encyclopedia and reference library. Written by web developers, for web developers. It includes articles on web security, JavaScript DOM manipulation, CSS tips and tricks, and more. The reference section includes a growing library of test cases for checking cross-browser and cross-platform compatibility.
Many sites offer browser compatibility charts, but few back up their compatibility claims with repeatable tests. Google believes strongly in the value of test cases and automated regression testing. All of the tests in Google Doctype can be run individually or in groups, using the JSUnit automated testing framework. This allows us to update our charts quickly and easily as new browser versions come out. It also allows you to test in your own browser to see exactly what the compatibility claims mean.
Many sites offer developer resources for the open web, but few sites make those resources available under open licenses. You can read, but you can’t download. Or you can download, but you can’t redistribute. Google makes it easy to download the entire encyclopedia and take it with you, publish it on your private intranet, or package it for redistribution.
Source: Google Doctype
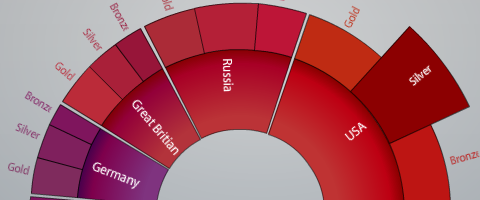
Visifire is a set of open source data visualization components – powered by Silverlight. With Visifire you can create and embed visually stunning animated Silverlight Charts within minutes. Visifire is easy to use and independent of the server side technology. It can be used with ASP, ASP.Net, PHP, JSP, ColdFusion, Ruby on Rails or just simple HTML. Visit Visifire Gallery or design your own chart using Chart Designer.


Requirements: –
Demo: http://www.visifire.com/
License: GPL License
John Resig has ported the Processing visualization language to JavaScript, using the Canvas element called The Processing Language. The first portion of the project was writing a parser to dynamically convert code written in the Processing language, to JavaScript. This involves a lot of gnarly regular expressions chewing up the code, spitting it out in a format that the browser understands. The language includes a number of interesting aspects as follow.
- Types and type casting – Type information is generally discarded, but becomes important in variable declaration and in casting (which is generally handled well).
- Classes – The full class system is supported (can be instantiated, etc. just fine).
- Method overloading and multiple constructors – Within classes you can have multiple method (or constructor) definitions – with the appropriate methods being called, based upon their signature length.
- Inheritance – Even classical-style inheritance is supported.
The second portion of the project is the full 2d Processing API. This includes all sorts of different methods:
- Shapes drawing
- Canvas manipulation
- Pixel utilities
- Image drawing
- Math functions
- Keyboard and mouse access
- Objects (point, arrays, random number generators)
- Color manipulation
- Font selection and text drawing
- Buffers

The full source code of The Processing Language is contained within a single file. It comes in at about 5000 lines, compresses down to less than 10kb. It is licensed under MIT license.
Requirements: –
Demo: http://dev.jquery.com/~john/processing.js/examples/basic/
License: MIT License
Polls Boutique is one of the polls resources on the web, offering a wide selection of polls on every topic. In Polls Boutique, anyone can vote on existing polls, and post new polls. It’s simple, quick and free. The polls can include pictures, embedded video, audio, hyperlinks and text.
After voting, users get to see their buddy icon represented near the poll option of their choice, and see what others are voting. It’s a fun way to meet new people with the same opinions (or not) as yours. The results page offers a great statistical playing field with cute pie charts and graphs showing all kinds of different statistical data harvested from the votes.

Requirements: –
Demo: http://www.pollsb.com/
License: License Free
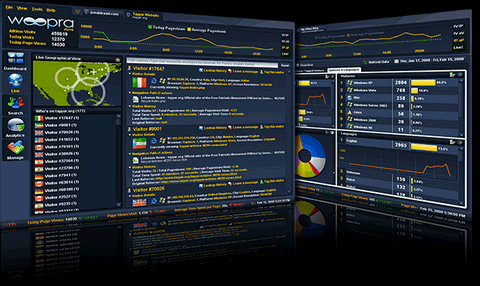
Woopra is a web-tracking & analysis tool. It is mainly targeted for small to medium websites ranging from few hundreds up to tens of thousands of daily page views. Essentially, it is targeted for blogs interested in the most minuscule details of every single action. In addition, Woopra provides a precise real-time streaming of every single activity on the website. Woopra also features a clean interface, including many graphical visualization components, such as charts, maps, panels… Along with many other clean and advanced options that make Woopra an ideal solution for webmasters who desire to discern all the aspects of their website. Here are the main features of Woopra.
Live Tracking
Webmaster will be immediately updated with all the actions taking place on his website. Woopra makes tracking seamless with its inherent live technology.
Rich Interface
Woopra provides an intuitive interface to display complex data sets (such as maps, charts, etc…) , without discarding the balance between design and function, creating elegant data visualizations.
Activity Search
Woopra log shows you all the events on your website in chronological order, offering an outstanding tool to go back in time and identify all the actions that took place.
Instant Messaging
Woopra enables you to engage your visitors by starting a conversation with them; a friendly popup will appear on the web page to establish the chat. Also, Woopra provides your visitors with a special link on the page, to be able to start a conversation.
Notifications
By putting valuable information around real-time data, Woopra provides an on-demand notification component highlight operational data and apply intelligence to make the data actionable and to spot special events.
Developer Tools
For developers and enthusiast users, Woopra provides a full featured API that allows extracting a website’s data into several common web 2.0 formats, making it useful for use within your own application.
Requirements: –
Demo: http://www.woopra.com/
License: License Free


