I’m currently spending most of my time explaining to students, hobbyists, professional developers and teachers how to build games using HTML5. I then recently thought: rather than keeping all these details for small audiences, wouldn’t it be smarter to share it with you?
This article is then based on my own experience. I will probably omit some crucial things some of you may know. But it will try to update this blog post along with my own new discovers and of course based on the feedbacks you will kindly provide in the comments or via Twitter.
But why are so many people currently interested in HTML5 Gaming?
Well, simply because today, we can really use HTML5 to target multi-platforms using the same code: for desktop machines of course (with IE9/IE10, Firefox, Chrome, Opera & Safari), for iOS & Android tablets & phones and Windows 8, and its future associated millions of tablets & PC, is also warmly welcoming HTML5 Games! I then frequently see some HTML5 gaming projects ported to each of these platforms with almost no effort.
What’s more, the modern JavaScript engines performance coupled with the GPU hardware-accelerated graphics layers enable us to build great games in HTML5 with confidence.
Note: we will only talk about the <canvas> tag of HTML5 and about SVG in this article.
Canvas & SVG: 2 ways to draw on the screen
The first thing you need to understand before building your first HTML5 game is how to draw nice objects on the screen. There are 2 ways to do that and to better understand their differences, you should start by reading this article from Patrick Dengler (member of the SVG W3C Working Group): Thoughts on when to use Canvas and SVG
On my side, I’ve re-used parts of Patrick’s materials to build a 45min internal session for my Microsoft’s colleagues last year. You can watch it via this video I’ve made (using HTML5 <video> of course!): Read the rest of this entry »
GitHub Survivor is a simple bug dashboard that shows an overview of bugs in a GitHub-hosted repo. 99designs is using it at to keep an eye on the bug count and remind themselves to close bugs.
It’s easy to forget about bugs when you’re knee-deep in feature development. This dashboard is a good way to keep bugs on people’s minds, and to show at-a-glance information about the current bug situation. GitHub Survivor scrapes your bug data using the GitHub API and stores it in your local Mongo DB for subsequent querying.
A bug leaderboard occupies the bulk of the screen. It shows who’s closed the most bugs this sprint and who’s forgotten to spend some time fixing bugs. There are charts showing the number of bugs opened and closed in recent sprints, the open bug count over time, and a big indicator showing the current open bug count.

Requirements: Github
Download Link: https://github.com/99designs/githubsurvivor
License: MIT License
A modern and easy to use Admin User Interface is the key to success of web applications. A custom made web admin user interface usually cost you a fortune.
Due to the popularity of 20 Professional Web Admin Templates we have published a year go, we have hand picked the following 10 New Professionally Designed Admin Templates on ThemeForest. You may find them useful when designing your own web application. All of them are professionally designed, and selling at a very low price.
1) Supr Responsive Admin Template
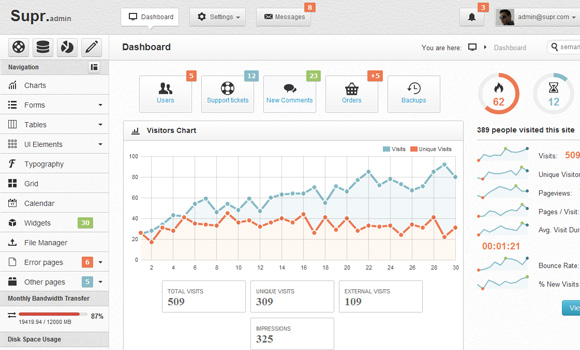
Supr is a full admin skin based on popular Twitter Bootstrap framework. This template is designed to help you build the site. Administration without losing valuable time. Template contains all the important functions which must have one backend system.
2) Aquincum Responsive Admin Template
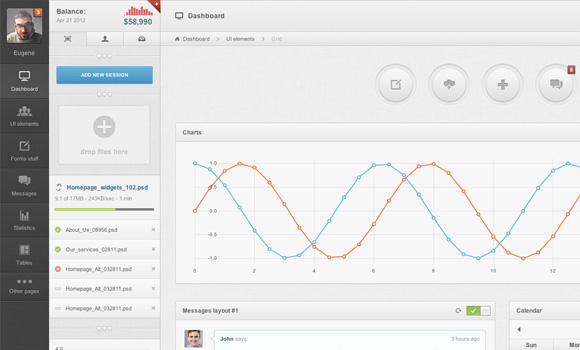
Aquincum – a new premium admin skin with lots of custom elements, 35+ plugins and very flexible content structure. It has 3 columns liquid structure with 3 level navigation and 2 level sidebar. Available 10 main backgrounds, compatible with Bootstrap 2.0.3 and latest jquery versions.
3) Zice Admin Colorful Admin Templates
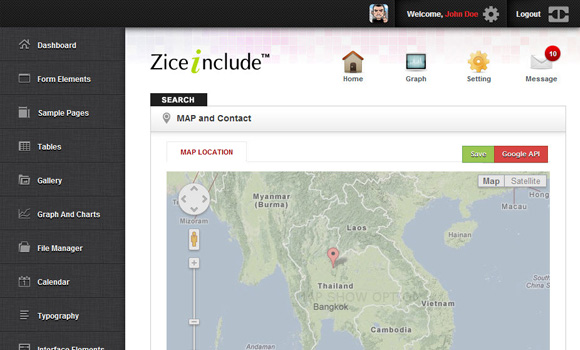
Zice Admin is Colorful Admin theme, includes dashboard, form, full option gallery, graph presentation, file management, calender, user interface, map & location, error page, 200+ icon,Theme PSD File and documentation for admin management. It is colorful style effect and design templates for easy to use
Read the rest of this entry »
Rickshaw is a simple framework for drawing charts of time series data on a web page, built on top of Mike Bostock’s delightful D3 library. These charts can be powered by static historical data sets, or living data that continuously updates in real time.
Rickshaw was a JavaScript toolkit for creating interactive time series graphs for Shutterstock. Rickshaw makes every effort to provide help for common problems without obscuring anything underneath it.

Requirements: JavaScriptFramework
Demo: http://shutterstock.github.com/rickshaw/
License: See License
EditableGrid is an open source Javascript library aimed at turning HTML tables into advanced editable components. It focuses on simplicity: only a few lines of code are required to get your first table up and running.
It loads grid from XML or attach to an existing HTML table. Built-in validators for columns of type integer, double, url, email and date. Sort columns accordingly to their types, by clicking on the column header. Open Flash Chart integration to render charts from the grid data. Callbacks for all events: load, edition, sorting, etc.

Requirements: Javascript Enabled
Demo: http://www.webismymind.be/editablegrid/
License: GPL License
HumbleFinance is an HTML5 data visualization tool written as a demonstration of interactive graphing in HTML5. It is similar to the Flash tool on Google Finance. The tool itself is written entirely in JavaScript, using the Prototype and Flotr libraries. It can be used to display any two 2-D data sets of real numerical data which share an axis.
You can mouse over the chart for additional data, as well as zoom and pan the charts using the grey bottons. For best results view with FireFox, Chrome, or Safari.

Requirements: Prototype 1.6.1+, Flotr 2.0 (modified)
Demo: http://www.humblesoftware.com/finance/index
License: MIT License
You can find a tool for just about anything online, there’s only one problem: they cost money, and in some cases, lots of it! Many online tools offer a free basic package for anyone to use, but these packages are often strictly limited, rendering these tools practically useless until you stump up the cash. In most cases, however, there are free alternatives available, many of which are very, very good indeed.
Below, you’ll find 15 Best Free Online Tools for Web Design and Development. Rather than narrow our focus, we’ve covered various aspects of the design and development process, to include the admin side of freelancing or running a small business.
No two tools listed below perform the same function; we’ve chosen our favorite tool for doing each job. You’ll find the best free online tool for project management, one for invoicing, one for screen sharing, one for instant messaging, one for mocking up layouts, and much more besides.
1. Redmine
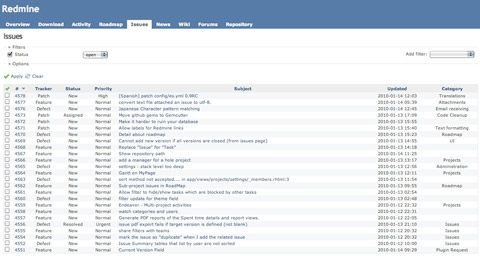
Redmine is a great, free alternative to other pricey project management apps available online. It does pretty much everything you could possibly desire, albeit in a less polished way than some of its more expensive rivals. With Redmine, you can manage a large number of projects simultaneously, defining personal roles and assigning tasks to specific team members if necessary. You can track time and issues, create Gannt charts and calendars, create project wikis and forums, and manage documents and files.
2. Billing Boss
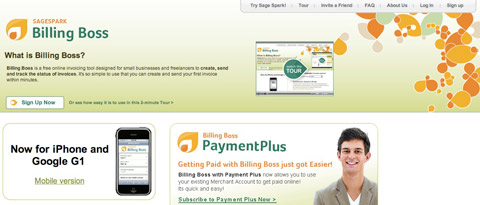
Billing Boss is a fantastic, free invoicing tool, designed especially for small businesses and freelancers, which lets you send an unlimited number of invoices to an unlimited number of clients, quickly and easily. All of your invoices are saved automatically and catalogued in a logical, understandable way. Billing Boss supports multiple currencies, is integrated with PayPal and is mobile friendly. You can even share your account with your bookkeeper or accountant.
3. Yuuguu
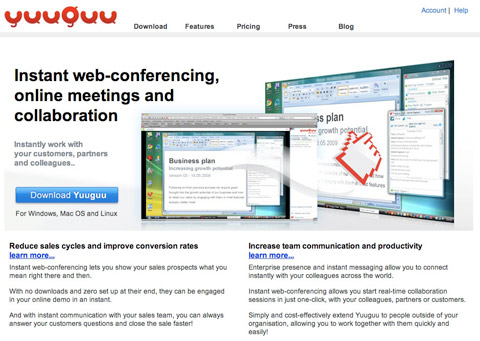
Yuuguu is a multi-platform screen-sharing tool, which allows Windows, Mac and Linux users to collaborate. You can quickly initiate an instant messaging session with a client or team member, sharing each others’ screens at the touch of a button. It’s perfect for working together on document presentations or for writing and editing documents in a group.
With Yuuguu, there’s nothing to download at either end, which means you can start sharing and communicating in seconds. The free Yuuguu package includes unlimited use with other Yuuguu users and 100mins/month use with non-Yuuguu users, as well as up to 5 participants in a single session. Read the rest of this entry »
Grafico is a javascript charting library built with Raphaël and Prototype.js. The library provides a wide array of graphs and stays with the guidelines laid out by Stephen Few and Edward Tufte. Grafico provides pretty charts that effectively communicate their information.
This means you get awesome graphs such as stacked area charts and sparklines, but no pie charts or bar charts with every bar a different color. Each graph type has numerous API options to customize it’s look and behavior. Some highlights: pop-up hovers, meanlines and watermarks. Minified, Grafico is about 30kb and available under the MIT license.

Requirements: Raphaël and Prototype.js
Demo: http://kilianvalkhof.com/2010/design/grafico-javascript-charting-library/
License: MIT License
When we are designing a website, or even a web application, we always need some pretty icons in order to complete the design. There are over hundred thousands of icons available on the internet. However, how many of them are nicely designed and suitable to you? I am sure you will find “The Best Free Web Icons for Different Purposes” useful to you.
We have selected the following top quality web icons, e.g Blogging Icons, Application Icons, Social Media Icons, Emotion Icons, Browser Icons, Mini Icons, Weather Icons, Flag Icons and Mobile Icons, which can be used for different purposes. Come back here if you ever designing a website again, I am sure you can find the web icons you need here.

You can use these icons on your blog. Cute Blogging Icon Set inclides Design, Download, Freelance, Part-time, Hire Me, Not Available, About Me, Services, My Blog, Contact.
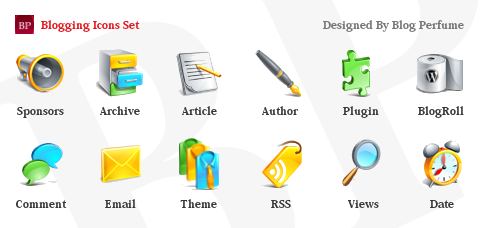
There are total 12 shiny and modern icons for your blogs including Author, Article, BlogRoll, Comment, Email, RSS, Theme icon and etc… It comes with 3 sizes, 24×24, 36×36 and 48×48 in png format.
Read the rest of this entry »
Highcharts JS is a charting library written in pure JavaScript, offering an easy way of adding interactive charts to your web site or web application. Highcharts JS currently supports line, spline, area, areaspline, column, bar, pie and scatter chart types.
It works in all modern browsers including the iPhone and Internet Explorer from version 6. Setting the Highcharts configuration options requires no special programming skills. The options are given in a JavaScript object notation structure, which is basically a set of keys and values connected by colons, separated by commas and grouped by curly brackets.
On hovering the chart, Highcharts JS can display a tooltip text with information on each point and series. By zooming in on a chart you can examine an especially interesting part of the data more closely. Zooming can be in the X or Y dimension, or both. Highcharts is licensed under a Creative Commons Attribution-NonCommercial 3.0 License.

Requirements: Javascript Enabled
Demo: http://www.highcharts.com/demo
License: Creative Commons License


