xCharts is a JavaScript library for building beautiful and custom data-driven chart visualizations for the web using D3.js. Using HTML, CSS, and SVG, xCharts are designed to be dynamic, fluid, and open to integrations and customization.
Since xCharts use SVG, we are able to accomplish most of our styling of xCharts directly through CSS. This means you have quite a bit of control to handle the visualization however you want. The best way to style charts is to start with the included stylesheet, or use your browser’s element inspector to see each elements CSS class selectors that are available to use.

Requirements: D3.js
Demo: http://tenxer.github.com/xcharts/
License: License Free
We have mentioned Tinycon some time ago, which allows the addition of alert bubbles and changing the favicon image. Now, we got Piecon, which is a tiny javascript library for dynamically generating progress pie charts in your favicons.
Piecon has been tested on Chrome 15+, Firefox 9+, Opera 11+. And the library falls back to title updates for Internet Explorer 9 and Safari 5+. It is licensed under the MIT license. It is pretty handy for web applications I think.

Requirements: JavaScript framework
Demo: http://lipka.github.com/piecon/
License: MIT License
Peity is a simple jQuery plugin that converts an element’s content into a simple mini canvas pie, line or bar chart. It works on any browser that supports <canvas>: Chrome, Firefox, Opera, Safari. Peity also adds a “change” event trigger to your graph elements, so if you update their data your can regenerate one or more charts by triggering change() on them.

Requirements: jQuery Framework
Demo: http://benpickles.github.com/peity/
License: MIT License
Smoothie Charts is a really small charting library designed for live streaming data. Joe Walnes wanted to show real time streaming data pushed over a WebSocket. Although many of the charting libraries allow you to dynamically update data, none have really been optimized for a constant stream of data.
Smoothie Charts only works on Chrome and Safari. And it doesn’t support legends. Or pie-charts. In fact, it’s inferior in virtually every way to a library like Flot. But, it’s very good at displaying streaming data.

Requirements: Chrome and Safari 5
Demo: http://smoothiecharts.org/
License: MIT License
Thank you for all of the participants of Giveaway 5 x Professional Licenses of FusionCharts v3. We are happy to announce the following 3 winners. Congratulations. FusionCharts will contact you guys shortly with the instruction of getting your free subscriptions.
1. Robert Durish, 2. craig, 3. Kim Steinhaug, 4. Kevin S, 5. David Pruitt
WebAppers will continue giving away some really nice web development tools and resources to our readers. Please feel free to suggest what you would like for the next Giveaway under this post. Thank you.
FusionCharts helps you create animated and interactive Flash charts for web and desktop applications. It livens up your applications by converting monotonous data into exciting visuals. FusionCharts offers over 45 types of 2D/3D charts including line, area, bar, column, pie, doughnut (donut), combination, scatter, bubble, scroll charts etc.
FusionCharts Free is a completely free and open-source Flash charting component. It aims to fulfill your basic charting needs with a very commonly used set of charts, having the necessary but basic features. The product is completely free with no gimmicks and no hidden pitfalls. Its features however are a lot limited than FusionCharts v3.
FusionCharts v3, on the other hand, provides you advanced charting options like exporting chart as image/PDF, gradients, 3D lighting, better animation with an easy way for building your own animation styles, exporting chart data as CSV/XML, in-built debugger, enhanced AJAX support and advanced filter effects like shadow, blur and bevel which you can apply to the various chart elements. It also provides advanced chart types like true 3D charts, scroll charts, glass-effect column charts, dual Y-axis charts to name a few.
FusionCharts is very kind to giveaway 3 x Professional Licenses ($499 each) of FusionCharts v3 to our readers. Simply leave a comment and tell us what you love most about FusionCharts and one improvement that should be made to it. We will randomly select 3 lucky people and announce the winners on 28th March. What are you waiting for?

24-03-2010 UPDATE: FusionCharts are pretty overwhelmed with the insights they have got from your valuable comments. Now, they would love to give out 5 Professional Licenses instead of the 3 we had earlier announced!
dygraphs is an open source JavaScript library that produces produces interactive, zoomable charts of time series. It is designed to display dense data sets and enable users to explore and interpret them. You can mouse over to highlight individual values. Click and drag to zoom. Double-click to zoom back out. Change the number and hit enter to adjust the averaging period.
Another significant feature of the dygraphs library is the ability to display error bars around data series. dygraphs is purely client-side JavaScript. It does not send your data to any servers – the data is processed entirely in the client’s browser.

Requirements: JavaScript Enabled
Demo: http://www.danvk.org/dygraphs/
License: License Free
Filament Group wrote an article describing how to use JavaScript to scrape data from an HTML table and generate charts using the HTML 5 Canvas element. The technique is particularly useful because the data for the visualization already exists in the page in structured tabular format, making it accessible to people who browse the web with a screen reader or other assistive technology.
Now they have rewritten and extended the code behind the technique and packaged it up as a new jQuery plugin called “Visualize“, which you can download. The plugin provides a simple method for generating bar, line, area, and pie charts from an HTML table, and allows you to configure them in a variety of ways.

Requirements: IE6, IE7, IE8, Firefox 2, Firefox 3.5, Safari 3 and 4, Opera 9
Demo: http://www.filamentgroup.com/examples/charting_v2/index_2.php
License: MIT, GPL License
Diagrams are great, because they are a very simple and extremely efficient way to intelligibly represent even the most complex ideas. But drawing diagrams can also be very complicated, simply because most diagramming softwares require you to draw.
Lovely Charts is an online diagramming application, that allows you to create professional looking diagrams of all kinds, such as flowcharts, sitemaps, organisation charts, wireframes, and many more… for free.
With Lovely Charts’s extremely simple and intuitive drag’n drop drawing mechanism, you’ll be able to focus on what really matters. You won’t have to draw boxes and arrows, you won’t have to worry about what symbol to use.
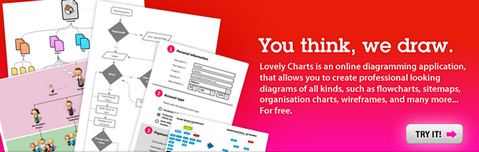
Source: Lovely Charts
JS Charts is a free JavaScript based chart generator that requires little or no coding. With JS Charts drawing charts is a simple and easy task, since you only have to use client-side scripting (i.e. performed by your web browser). No additional plugins or server modules are required. Just include the scripts, prepare your chart data in XML or JavaScript Array and your chart is ready.
JS Charts lets you create charts in different templates like bar charts, pie charts or simple line graphs. It’s compatible with most web browsers. And it is It’s free to use and watermark-free.

Requirements: Firefox 1.5 +, IE 6, Safari 3.1 +, Opera 9 +
Demo: http://www.jscharts.com/examples
License: Creative Commons 3.0 License


