Open Web Analytics (OWA) is an open source web analytics framework written in PHP. OWA was born out of the need for an open source framework that could be used to easily add web analytics features to web sites and applications.
The OWA framework also comes with built-in support for popular web applications such as WordPress and MediaWiki. As a generic web analytics framework, OWA can be extended to track and analyze any web application.

Requirements: PHP 4.4.2+, GD library
Demo: http://www.openwebanalytics.com/
License: GPL 2.0 License
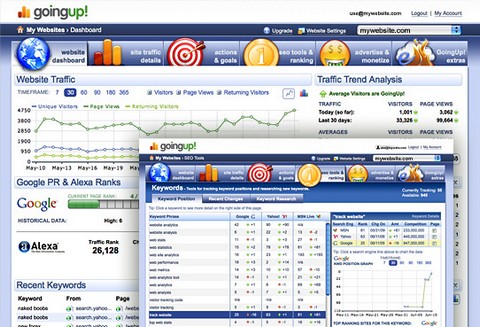
With an AJAX-rich interface, GoingUp! combines powerful web-analytics with top notch SEO tools. Firstly, you can get a Complete WebSite Stats, check your visitors, referring URLs and even search engine traffic. Secondly, you can also Track Keyword Positions, see your SEO efforts by graphing keyword positions over time. Thirdly, you can set Actions & Goals, set custom tracking events to see sales, downloads and subscribes. Lastly, you can easily Customize Dashboard, Show only the data you want to see with the slick AJAX interface.
GoingUp! now lets you earn points while using the web analytics tracking as well. Soon, you’ll be able to use these points for premium services such as search engine promotion, keyword rank monitor and more. Plus, you can even turn your points into cash or prizes. Simply install the GoingUp! PHP tracking code on your site and your points will start to accumulate.
Requirements: –
Demo: https://www.goingup.com/
License: License Free
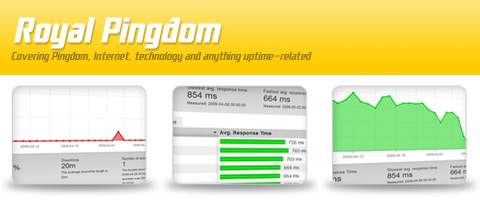
Pingdom is a service that monitors websites and servers from the Internet and alerts you if there is a problem. It acts like a watchdog, making sure that your website is up and running 24/7. You handle all your settings from an online control panel. No need to install anything. You can get error alerts via both email and SMS.
Now, you can use Pingdom for free. It is not a free trial, but a completely free account that you can use for as long as you like. Pingdom Free has all the features of the paid account types. The only limitation is that you can only monitor one website or server, but that should be enough for a lot of bloggers and hobbyist webmasters.
Source: Pingdom adds FREE website monitoring
It is a good news to web application developers. Google Analytics Data Export API beta is now publicly available to all Analytics users. The Data Export API is easy to use and provides read-only access to all your Analytics data. Any data that’s available through the standard Analytics web interface is available through the API.
Developers can integrate Google Analytics into their existing products and create standalone applications that they sell. Users could see snapshots of their Analytics data in developer created dashboards and gadgets. Individuals and business owners will have opportunities to access their Google Analytics information in a variety of new ways with Google Analytics Data Export API.
For example, you can accessing Analytics from your desktop with Polaris from now on. Polaris is a cross-platform desktop widget for Google Analytics. With 8 standard reports it’s the easiest way keep your data always instantly available. The rich interface and swift navigation make it a pleasure to use.


Source: http://analytics.blogspot.com/2009/04/attention-developers…

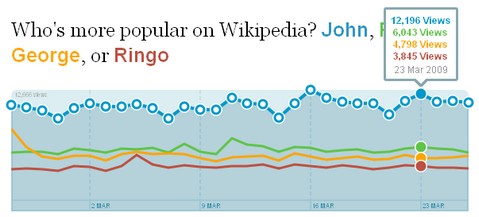
Wikirank shows you what people are reading on Wikipedia. It’s based on the actual usage data from the Wikipedia servers, which the Wikimedia foundation makes available as a public service. They take that data, process it, and give it back to you in a format that’s easy to use and share. Wikirank reveals emerging trends, and lets you embed relevant charts in blog posts and on social media sites.
From a technical perspective, the charts on Wikirank are based on logs from Wikipedia’s HTTP Squid proxy servers. That means every single page load is recorded, whether initiated by a human with a browser or a Web spider crawling through. Therefore, the numbers for a topic on a particular day can’t be considered absolute impressions the way, say, an ad server might count them.
The data of Wikirank indicates relative increases or decreases, so the shape of the charts is more important than the specific number of views. Comparisons are even more interesting, as relative interest in multiple topics can be ranked.
Requirements: –
Demo: http://wikirank.com
License: GFDL License
UvumiTools Odometer is an odometer style Javascript counter, where you can actually see the numbers spining. It is a Mootools plugin requires no Flash, it’s all CSS and Javascript. It can serve multiple purposes, like a live visit counter or a cashier style counter on a shopping website. It can be anything that involves updating a numeric value dynamically.
UvumiTools Odometer can be be updated manually or you can set it so it periodically calls a server script via an AJAX request and uses the returned value as a new target. This is also easy, you just need to specify the URL to that script when you initialize the counter. If the difference between two values is too big and the counter is spinning for several minutes. You can directly jump to the targeted value by simply double-clicking on the counter.

Requirements: Mootools 1.2+
Demo: http://tools.uvumi.com/odometer.html
License: MIT License

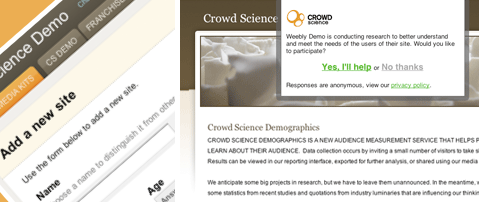
Crowd Science Demographics is a new audience measurement service that gives website publishers insight into the demographics and attitudes of their audience. Focusing on more than page views, clicks and behavior, Crowd Science Demographics builds an audience profile including age, gender, income level and other demos that provide you insight to your audience.
Crowd Science can help you create a model of your audience that reveals more than the records of IP addresses and page views. Their audience measurement service is able to build deep, topic-area-specific statistical models of the demographics and attitudes of the visitors to your website.
Their research methodologies are as polite and non-intrusive as possible – they recognize the advantage of an engaged audience and the very obvious disadvantage of having one that won’t come back. Activating your website is a breeze. The data will be yours to keep and to use for any purpose, evil or otherwise. Whether you are a publisher, a blogger, an advertiser or a researcher, Crowd Science can help you understand your crowd.
Crowd Science is currently under Close BETA. However, they are very kind to give WebAppers readers 100 invitations. You can sign up with invitation code: WEBAPPERS. Hurry up!
Requirements: –
Demo: http://www.crowdscience.com/
License: License Free
Do you feel that Alexa is inaccurate? Now you have another option to compare websites traffic. With Google Trends for Websites, you can get insights into the traffic and geographic visitation patterns of your favorite websites. You can compare data for up to five websites and view related sites and top searches for each one.
Trends for Websites shows you a graph reflecting the number of daily unique visitors to that website. You can see these numbers on the graph after you’ve signed into your Google Account. Under the graph, you’ll also see a list of regions where visitors originated from, other websites that they have also visited, and terms they have also searched for.
Trends for Websites combines information from a variety of sources, such as aggregated Google search data, aggregated opt-in anonymous Google Analytics data, opt-in consumer panel data, and other third-party market research. The data is aggregated over millions of users, powered by computer algorithms, and doesn’t contain personally identifiable information. Additionally, Google Trends for Websites only shows results for sites that receive a significant amount of traffic, and enforces minimum thresholds for inclusion in the tool.

Requirements: –
Demo: http://trends.google.com/websites
License: License Free
Introducing Feed Compare, a free web application that you can use for comparing FeedBurner feeds. This tool is great for checking out your competition and noticing trends in growth.
Much like comparing website ranks using the Alexa website, you can use Feed Compare to compare your feeds against up to three other feeds. All you have to do is input the name of your feed, and then the name of your competitors feeds.
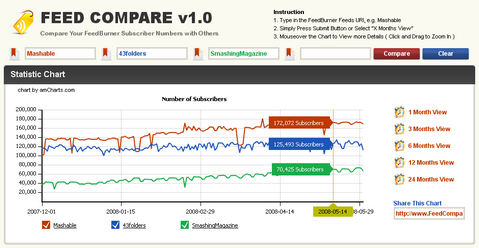
Features for this tool include: viewing up to 24 months worth of data (other options are: 12 months, 6 months, 3 months and one month). Zoom in on particular timeframes using click and drag. Users can link directly to the feed comparisons chart much like Alexa ‘permalink’ style. And it allows users compare up to 4 feeds at a time.
Requirements: –
Demo: http://www.feedcompare.com
License: License Free

Yes, we all love Google Analytics. However, it does not stop us looking at other good alternatives. W3Counter is your free, hosted website analytics solution for answering the key questions about your website: who’s your audience, how they find your site, and what interests them. There’s no installation, no configuration, and tracking starts as soon as you copy-and-paste a snippet of code into your website. Here is a list of features you can find on W3Counter, but not on Google Analytics.
Follow Your Visitors
Since W3Counter’s service is truly real-time, you can follow visitors as they browse your website. See who’s online at any time and their entire path from referring source to the page they’re currently viewing. Plus, view detailed activity for visitors that have recently left your site as well.
Visitor Identification
Label your visitors, as easily as installing a plugin on a WordPress blog or adding a few lines of JavaScript to your membership or customer-based website. Your labels will appear in your reports of online and recent visitors, where you can view all the past activity of each member or customer on your website.
Web Stats Widgets
Share your web stats with the world. Embed them in your website or blog with 7 different widgets including visitor maps, top pages, top searches, weekly visit graphs and a live feed of the most recent people on your site. You can even pull up a click overlay of your site without logging in to W3Counter.
Tracking Feedburner Feed Stats
You can track your Feedburner Feed Stats easily with W3Counter. It shows Circulation, Hits and Reach for your Feedburner account by using Feedburner API. It also shows us a beautiful line chart for your RSS Stats as well.

Many small website owners remain on the free plan. However, free accounts are limited to websites receiving under 5,000 daily page views.
Requirements: –
Demo: http://www.w3counter.com/stats/2
License: License Free


