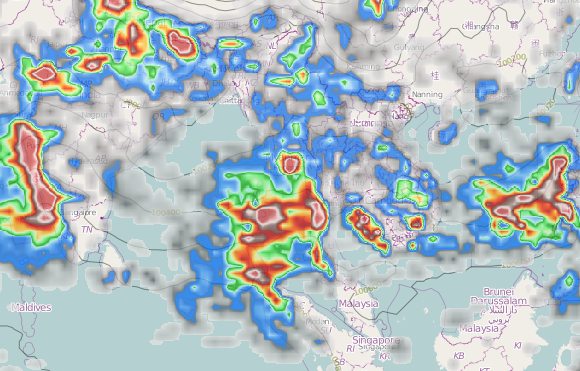
The OpenWeatherMap service provides free weather data and forecast API suitable for any cartographic services like web and smartphones applications. Ideology is inspired by OpenStreetMap and Wikipedia that make information free and available for everybody.
OpenWeatherMap provides wide range of weather data such as map with current weather, week forecast, precipitation, wind, clouds, data from weather stations and many others. Weather data is recieved from global meterological broadcast services and more than 40 000 weather stations.
You can recieve any weather data for your application by using JSON / XML API. Lots of applications for Android and iOS use OpenWeatherMap as weather data source. By the way the data can be received from WMS server and can be embedded into any cartographic web-application.
Requirements: –
Demo: http://openweathermap.org/
License: Creative Commons 2.0 License
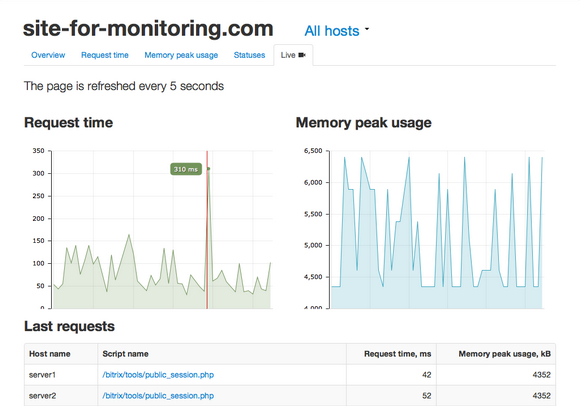
Pinba is a MySQL storage engine that acts as a realtime monitoring/statistics server for PHP using MySQL as a read-only interface. It accumulates and processes data sent over UDP by multiple PHP processes and displays statistics in a nice human-readable form of simple “reports”, also providing read-only interface to the raw data in order to make possible generation of more sophisticated reports and stats.
Intaro Pinboard is a simple PHP monitoring system, which aggregates and displays Pinba data. Originally Pinba saves realtime (or nearly realtime) data in own tables. Pinboard periodically dumps this data in own tables and displays core metrics on basis of own data and realtime data from Pinba.
Requirements: PHP Framework
Demo: http://intaro.github.io/pinboard/
License: MIT License
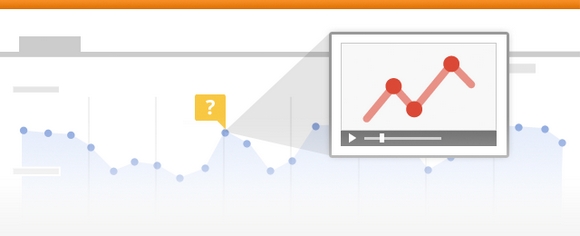
Every project needs analytics. But you shouldn’t have to litter your codebase with third-party-specific calls. Changing or adding new services should be a snap.
That’s where analytics.js comes in! Instead of adding hooks for every single analytics service you integrate, you add a single set of provider-agnostic hooks that then route to any analytics service you want! Analytics.js gives you a hassle-free way to integrate analytics into any web application.
Requirements: Google Analytics
Demo: http://segmentio.github.com/analytics.js/
License: MIT License
ABalytics.js is a pure javascript library allows you to do simple A/B testing working only on your client-side code. All data is registered as custom variables in your website Google Analytics profile, so you don’t need to configure anything server side.
You simply mark the html elements you want to test on with a class, the substitution is automatic. There is no need to set anything up server side, the data is stored on Google Analytics. You can conduct multiple, independent experiments at the same time. Each experiment will use a custom variable slot. It is pure javascript, you just need to include GA.

Requirements: JavaScript, Google Analytics
Demo: https://github.com/danmaz74/ABalytics
License: MIT License
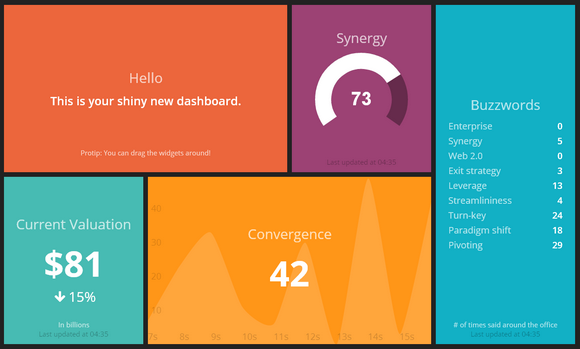
Dashing is a Sinatra based framework that lets you build beautiful dashboards. You can use premade widgets, or fully create your own with css, html, and coffeescript. Widgets harness the power of data bindings to keep things simple.
You can also use the API to push data to your dashboards, or make use of a simple ruby DSL for fetching data. It supports Drag & Drop interface for re-arranging your widgets. You can host your dashboards on Heroku in less than 30 seconds. Dashing was originally created at Shopify for displaying custom dashboards on TVs around the office.
Requirements: Ruby 1.9+
Download Link: http://dashingdemo.herokuapp.com/sample
License: MIT License
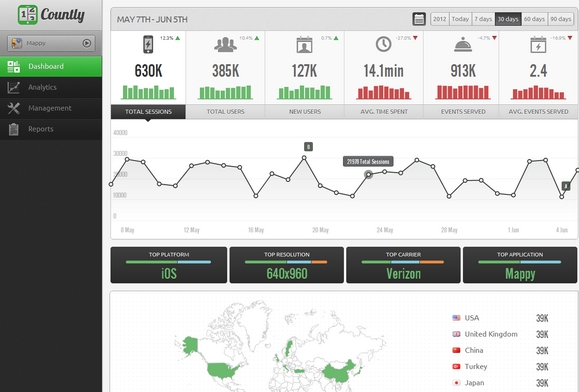
Countly is a real-time, open source mobile analytics application. It collects data from mobile phones, and visualizes this information to analyse mobile application usage and end-user behaviour.
Once you open the dashboard, you’ll be amazed to see how easy it’s to monitor your data with splendid graphics. Countly dashboard shows you everything at once in an elegant way. No need to dig in several pages to find the information you need. You can also track unlimited number of applications with Countly, and switch between your apps, games and ebooks easily.
Requirements: –
Demo: http://count.ly/dashboard
License: License Free
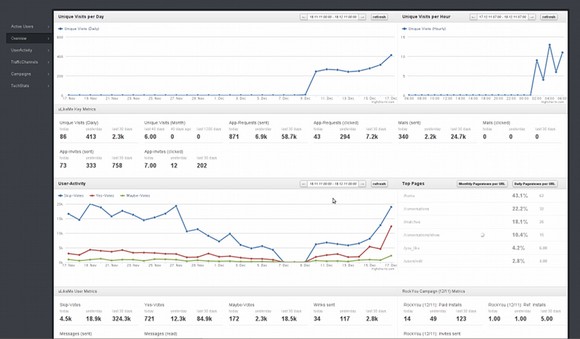
FnordMetric is a highly configurable (and pretty fast) realtime app/event tracking dashboard based on ruby eventmachine and redis. You define your own plotting and counting functions as ruby blocks.
FnordMetric gives you a live dashboard, that shows who is using your app in realtime. You can select a single user and follow them step by step as well. Best of all, it’s free for download and you can install it on your own server.
Requirements: –
Demo: https://github.com/paulasmuth/fnordmetric
License: License Free
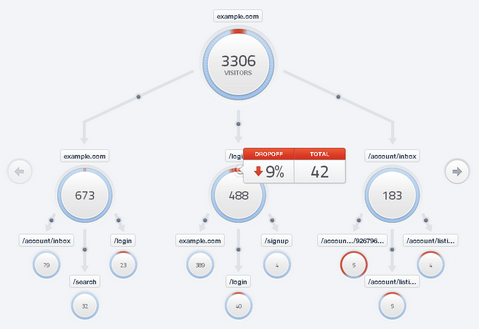
Flow is a traffic visualization like none you’ve ever seen. It’s beautiful, it’s fast, and it’s incredibly intuitive. Instead of a line graph or a table, you get a diagram of the actual paths people take as they browse your site. Follow your users every step of the way – from the homepage, through signup, and each page they hit as they use your product.
You can figure out which pages are working and which ones aren’t. Flow shows you exactly how many people leave from each page of your site. It takes less than a second for a user to show up in Flow. If you’re launching a brand-new site, it’s the fastest way to see what’s happening.
Requirements: –
Demo: https://flow.mixpanel.com/
License: License Free
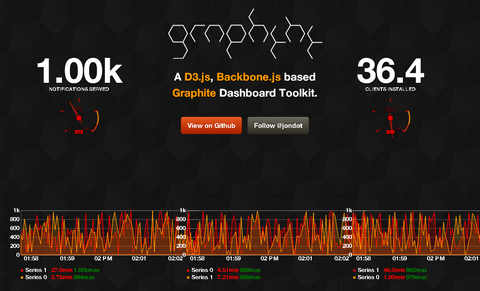
Graphene is a realtime dashboard & graphing toolkit based on D3 and Backbone. It was made to offer a very aesthetic realtime dashboard that lives on top of Graphite (but could be tailored to any back end, eventually).
Combining D3’s immense capabilities of managing live data, and Backbone’s ease of development, Graphene provides a solution capable of displaying thousands upon thousands of datapoints in your dashboard, as well as presenting a very hackable project to build on and customize.
Requirements: jQuery Framework
Demo: http://jondot.github.com/graphene/
License: MIT License
Either you’re a web developer, blogger or anyone with a website, you probably use Google Analytics to collect and process crucial data about your site’s visitors. Now, we got GAget for you, it is a Google Analytics Widget for Mac OS X Dashboard.
You can see the important information of the day without any clutter. You can check out the number of your visits for the last two weeks. See the rate of new visitors and bouncers. You can either refresh data with one click or wait for the automatic refresh. And it’s easy to switch between profiles too.

Requirements: Mac OS X
Demo: http://www.zoltanhosszu.com/gaget/
License: License Free


