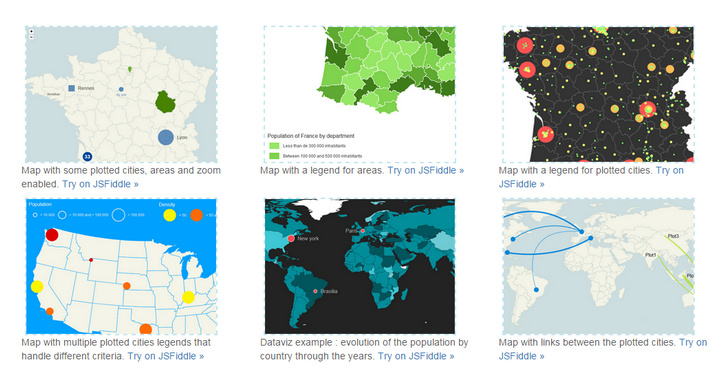
jQuery Mapael is a jQuery plugin based on raphael.js that allows you to display dynamic vector maps. For example, with Mapael, you can display a map of the world with clickable countries. You can also build simple dataviz by setting some parameters in order to automatically set a color depending on a value to each area of your map and display the associated legend.
Moreover, you can plot cities on the map with circles, squares or images by their latitude and longitude. Many more options are available, read the documentation in order to get a complete overview of mapael abilities. As Raphaël, Mapael supports Firefox 3.0+, Safari 3.0+, Chrome 5.0+, Opera 9.5+ and Internet Explorer 6.0+.

Requirements: Raphael.js
Demo: http://www.vincentbroute.fr/mapael/
License: MIT License
Building an analytics dashboard? Don’t start from scratch. Grab one of Keen IO Bootstrap-based Dashboards Templates and admire your data in minutes. You can create an attractive, custom analytics dashboard that’s ready to be shown to your team or your customers. No hours lost tweaking CSS or testing responsiveness on eight different mobile devices.

Requirements: Bootstrap Framework
Demo: http://keen.github.io/dashboards/
License: MIT License
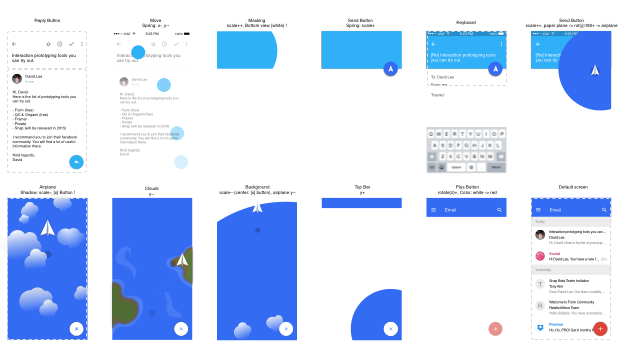
David Less has been using Form since Google acquired them. He has published his first Medium article to share the knowledge he learned while Building Email Interaction Prototype with Google Form. Even though the source code is still messy, but you can get a sense of how powerful Form is.
Every time he writes an email he feels like he is talking to a machine rather than person. He felt there was something missing in the digital communication. Should emails be always like that? That’s why he started to build this prototype. You can check out this tutorial.

Requirements: Google Form
Demo: https://medium.com/@designforhuman/how-i-built-email-interaction-prototype…
License: License Free
For Osvaldas Valutis’s latest responsive freelance project there was a contact page where he had to display several Google Maps instances on a single page. You can see where he is heading to: what if a user is not going to scroll down the page because the very first map is what a user was looking for? What if the user is accessing the page on a smartphone under the cellular internet connection?
The right way is to lazy-load the script file and map instances one by one. On every scroll and browser resize interval the Lazy-loading Google Maps Plugin checks whether there are any maps in the viewport to be displayed. If yes, it loads (if it wasn’t loaded before) Google Maps API script file and then initiates the corresponding map instances. Finally, there’s a callback function which is called within every map instance initiation so that you can continue doing whatever you need with your maps.

Requirements: jQuery Framework
Demo: http://osvaldas.info/lazy-loading-google-maps
License: MIT License
PhotoSwipe is a HTML/CSS/JavaScript based image gallery specifically targeting mobile devices. It is inspired by the iOS photo viewer and Google images for mobile. PhotoSwipe provides your visitors with a familiar and intuitive interface allowing them to interact with images on your mobile website.
All basic gestures are supported: flick to the next or previous image, spread to zoom in, drag to pan, pinch to zoom out or close, tap to toggle the controls, double-tap to zoom. PhotoSwipe manipulates the browser’s history so that the user can link to each gallery item and close the gallery via the “back” button. The initial URL is restored when the gallery is closed.

Requirements: JavaScript Framework
Demo: http://photoswipe.com/
License: MIT License
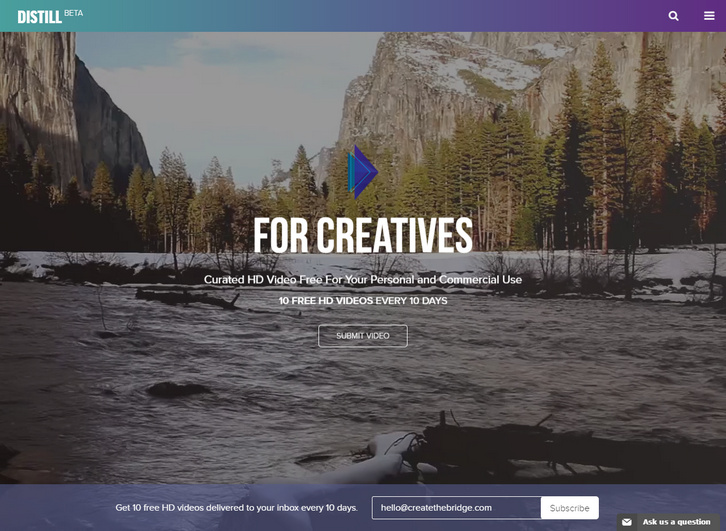
With the growing trend of websites using video as backgrounds (PayPal, AirBnB), and freemium stock content becoming more available, Create the Bridge has released Distill. Distill is a curated video resource platform that offers free, 10-30 second HD videos for anyone to download and use under the Creative Commons License Zero.
It will strengthen an artist’s name as an ambitious filmmaker, and allow them to reach a larger audience by being part of a curated platform. Build an archive for creatives looking to add a new form of visual communication into their web project. Allow video producers to discover high-quality video and/or new talent for their commercial projects.

Requirements: –
Demo: http://www.wedistill.io/
License: License Free
If you are into designing for multiple resolutions, SVG is the best option to turn to as far as the use of graphics is concerned. These small vector files can be scaled up and down as you like it without sacrificing quality. SVG Loaders is a collection of simple SVG loaders and spinners created and released by Sam. No images used, pure svg/css and scaleable.

Requirements: SVG Support
Demo: http://samherbert.net/svg-loaders/
License: MIT License
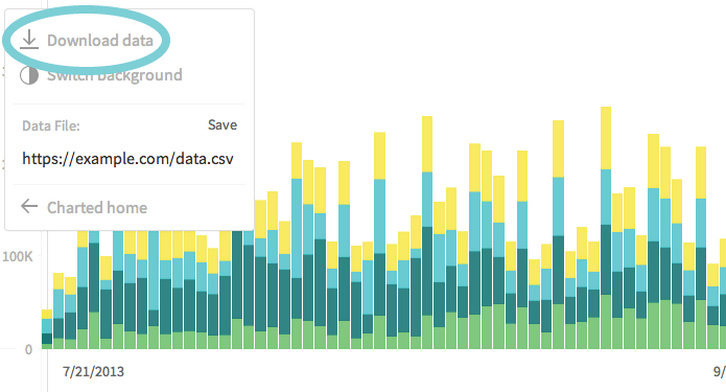
Charted is a tool for automatically visualizing data, created by the Product Science team at Medium. Give it the link to a data file and Charted returns a beautiful, shareable chart of the data. Charted does not store any data. It only fetches and visualizes what the link provides. It also refetches the data every 30 minutes, so the chart is always up-to-date.
Charted is open-sourced and available for anyone to use at charted.co. The publicly-hosted charted.co works with files that are already publicly accessible to anyone with the link (e.g., Dropbox share links). For protected or sensitive data, you can serve your own instance of Charted on your secure network.

Requirements: –
Demo: http://www.charted.co/
License: MIT License
MetricsGraphics.js is a library built on top of D3 that is optimized for visualizing and laying out time-series data. It provides a simple way to produce common types of graphics in a principled, consistent and responsive way. The library currently supports line charts, scatterplots and histograms as well as features like rug plots and basic linear regression.
The API is simple. All that’s needed to create a graphic is to specify a few default parameters and then, if desired, override one or more of the optional parameters on offer. The library is data-source agnostic. While it provides a number of convenience functions and options that allow for graphics to better handle things like missing observations, it doesn’t care where the data comes from.

Requirements: D3 Framework
Demo: http://metricsgraphicsjs.org/examples.htm
License: Mozilla Public License v2.0
Wami Map project makes OSM data for everyone, easily. They take advantage of MongoDB potential for big data management to implement a search for relevant data from OSM data sources. Their APIs make it possible to retrieve POI in different formats including geoJSON, which allows to display them directly on the client. Wami Map project is published under Apache 2 license, so feel free to fork it, use it and make it better.

Requirements: –
Demo: http://map.wami.it/
License: Apache License


