More than a Map demonstrates the capabilities and features of the Google Maps API. This site showcases the unique features of the Google Maps API and how developers are using it.
Through morethanamap.com you’ll learn how developers can embed popular Google Maps features like Street View, public transit directions, location data, and advanced data visualization capabilities into their website or app. The interactive demos on morethanamap.com show how these features are ready to be added to any website or app.
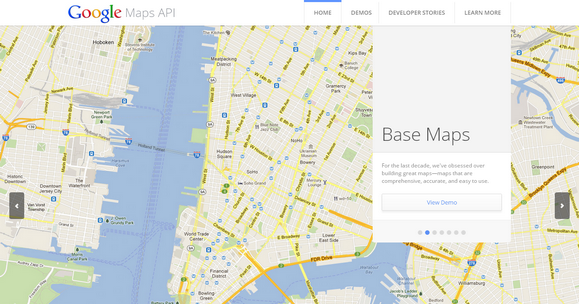
Source: http://www.morethanamap.com/
Kartograph is a new framework for building interactive map applications without Google Maps or any other mapping service. It was created with the needs of designers and data journalists in mind.
The core concept of Kartograph is to separate the mapping process in the map generation and map rendering part. The client-side library kartograph.js renders pre-generated maps stored in SVG files. You can chose among hundreds of ready-to-use maps or simply generate your own using kartograph.py, the open source Python SVG map generator.
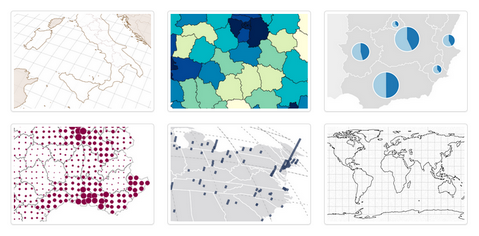
Requirements: jQuery and RaphaelJS Framework
Demo: http://kartograph.org/showcase/
License: GPL License
TileMill is an application for making beautiful maps. Whether you’re a journalist, web designer, researcher, or seasoned cartographer, TileMill is the design studio you need to create compelling, interactive maps.
TileMill is built on a suite of modern open source libraries including Mapnik, node.js, backbone.js, express and CodeMirror. Every map you make in TileMill is mobile ready. By leveraging the portable, fast MBTiles format, each TileMill map looks and works great on the web and offline.
You can enrich your maps with hover tooltips and clickable pop ups. Reveal details in your data by embedding numbers, graphs, and images into your map. TileMill leverages UTF-8 grid technology allowing you to leverage interactivity for hundreds of thousands of data points while maintaining high performance.
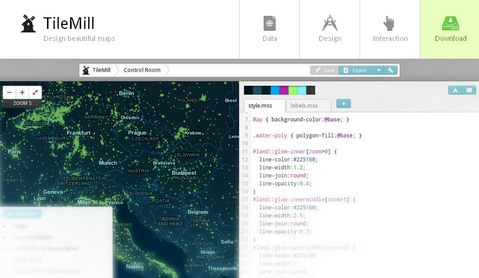
Requirements: –
Demo: http://mapbox.com/tilemill/
License: License Free
Have you ever create a really good looking interactive map using HTML5 and jQuery? MigrationsMap.net allows you to see for every country X in the world either the top ten providing countries of lifetime migrants to X or the top ten receiving countries of lifetime migrants from X.
On top of that, when you let your mouse hover over a country, you can see the total population, the GDP per capita, the HIV and Tuberculosis prevalences and the death rate of children under five. All the code of the site and the scripts used to produce it are available on github.
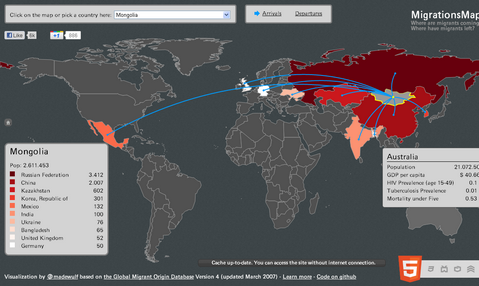
Requirements: HTML5 and jQuery
Demo: http://migrationsmap.net
License: MIT License
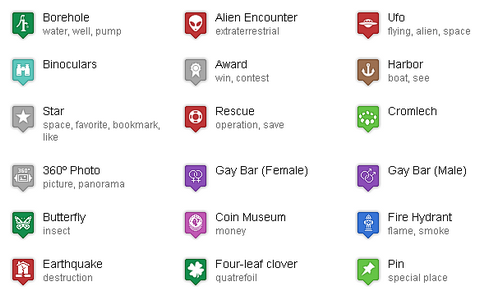
Map Icons Collection is a set of more than 700 free icons to use as placemarks for your POI (Point of Interests) locations on your maps. You can use them on Google Maps with the “My maps / my places” feature or automatically by using the Google Maps API.
All of the map icons are organized into logical color coded categories, for better and quicker overview, you get a complete and diverse collection of unique markers for point of interests, for example cinemas, hotels, banks, restaurants and stores.
Requirements: Google Map
Demo: http://mapicons.nicolasmollet.com/
License: Creative Commons License
jVectorMap is a jQuery plugin employed to show vector maps and visualize data on HTML pages. It uses SVG in all modern browsers like Firefox 3 or 4, Safari, Chrome, Opera, IE9, while legacy support for older versions of IE from 6 to 8 is provided with VML.
Using jVectorMap is pretty simple. All you need is to include JavaScript and CSS files. While initializing map you can  also provide parameters to change its look and feel easily.

Requirements: jQuery Framework
Demo: http://jvectormap.owl-hollow.net/
License: MIT License
Leaflet is a modern, lightweight BSD-licensed JavaScript library for making tile-based interactive maps for both desktop and mobile web browsers. It is built from the ground up to work efficiently and smoothly on both platforms, utilizing cutting-edge technologies included in HTML5.
Its top priorities are usability, performance, small size, A-grade browser support, flexibility and easy to use API. The OOP-based code of the library is designed to be modular, extensible and very easy to understand.

Requirements: Javascript Framework
Demo: http://leaflet.cloudmade.com/
License: BSD License
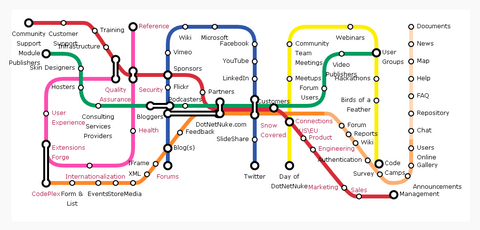
Have you been fascinated by the visual clarity of the London Underground map? Finally, with the advent of HTML5 element and jQuery, it is now possible to implement this in a way that with a little bit of effort, anyone who knows HTML can easily create a subway map.
Subway Map Visualization jQuery Plugin lets you create a beautiful, interactive subway map visualization for their website using HTML markup. The map size, line width and colors can all be customizable. The markup used to create the map is search engine friendly too.
Requirements: jQuery Framework
Demo: http://www.kalyani.com/2010/10/subway-map-visualization…
License: License Free
SimpleGeo provides an extremely scalable, cloud-based interface for storing, managing, and querying location data. Their prime offering includes a data library, tools for analyzing geodata, and mobile SDKs for quickly deploying advanced location features.
All of the SimpleGeo API is available through a REST interface using OAuth authentication. SimpleGeo data is made up of layers, which contain records. Each record can have metadata attached in the form of properties.

Requirements: –
Demo: http://simplegeo.com/
License: License Free
SpryMap is a super lightweight (2.8 KB), dependency free Javascript widget that turns any HTML element into a Google Maps-like click and drag window. SpryMap is released under the creative commons license, essentially you’re free to use it and adapt it for any personal or commercial purposes.
When using this script, you are given full control over how you want the map to act. What coordinates do you want it to start at? Do you want it to animate to a stop, or stop immediately when the user releases the mouse? Do you want the dragging to stop when an edge is hit? Would you like soup or salad with that? SpryMap aims to give you full control over how it acts.

Requirements: Javascript Enabled
Demo: http://candrews.net/sandbox/spryMap/
License: Creative Commons License


