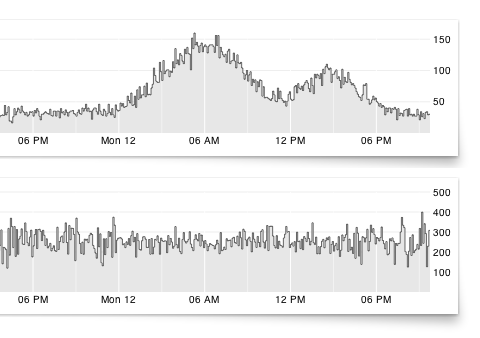
Rickshaw is a simple framework for drawing charts of time series data on a web page, built on top of Mike Bostock’s delightful D3 library. These charts can be powered by static historical data sets, or living data that continuously updates in real time.
Rickshaw was a JavaScript toolkit for creating interactive time series graphs for Shutterstock. Rickshaw makes every effort to provide help for common problems without obscuring anything underneath it.

Requirements: JavaScriptFramework
Demo: http://shutterstock.github.com/rickshaw/
License: See License
Toxiclibs.js is an open-source computational design library ported to javascript by Kyle Phillips originally written by Karsten Schmidt for Java and Processing. Toxiclibs.js has no external dependencies and can be used by itself or with any other library. Toxiclibs.js works great with the Processing.js visualization library for <canvas>, as well as Three.js, Raphael.js for SVG, or even just DOM manipulation.
This library is free software; you can redistribute it and/or modify it under the terms of the GNU Lesser General Public License as published by the Free Software Foundation; either version 2.1 of the License, or (at your option) any later version.

Requirements: –
Demo: http://haptic-data.com/toxiclibsjs/
License: LGPL License
jQuery OrgChart is a plugin that allows you to render structures with nested elements in a easy-to-read tree structure. To build the tree all you need is to make a single line call to the plugin and supply the HTML element Id for a nested unordered list element that is representative of the data you’d like to display.
You can show/hide a particular branch of the tree by clicking on the respective node. It is very easy to style using CSS. If drag-and-drop is enabled you’ll be able to reorder the tree which will also change the underlying list structure.

Requirements: jQuery Framework
Demo: http://dl.dropbox.com/u/4151695/html/jOrgChart/example…
License: Creative Commons 3.0 License
Cube is an open-source system for visualizing time series data, built on MongoDB, Node and D3. If you send Cube timestamped events (with optional structured data), you can easily build realtime visualizations of aggregate metrics for internal dashboards. For example, you might use Cube to monitor traffic to your website, counting the number of requests in 5-minute intervals.
Cube supports filters for aggregating a subset of events: you might filter requests for a specific path, host, or user-agent. Or perhaps plot the count of slow requests (>500ms) over time. You can also evaluate arithmetic expressions, even combining multiple event types, say to compare requests to signups for conversion tracking.

Requirements: Javascript Framework
Demo: http://square.github.com/cube/
License: Apache License
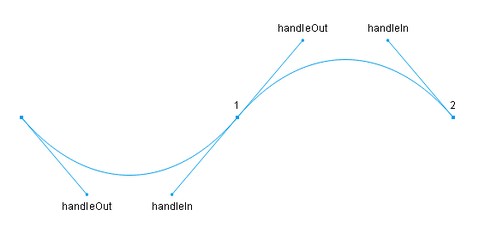
Paper.js is an open source vector graphics scripting framework that runs on top of the HTML5 Canvas. It offers a clean Scene Graph / Document Object Model and a lot of powerful functionality to create and work with vector graphics and bezier curves, all neatly wrapped up in a well designed, consistent and clean programming interface.
Paper.js is easy to learn for beginners and has lots to master for intermediate and advanced users. Paper.js is developed by Jürg Lehni & Jonathan Puckey, and distributed under the permissive MIT License.

Requirements: Browsers support Canvas and EcmaScript 5
Demo: http://paperjs.org/
License: MIT License
Peity is a simple jQuery plugin that converts an element’s content into a simple mini canvas pie, line or bar chart. It works on any browser that supports <canvas>: Chrome, Firefox, Opera, Safari. Peity also adds a “change” event trigger to your graph elements, so if you update their data your can regenerate one or more charts by triggering change() on them.

Requirements: jQuery Framework
Demo: http://benpickles.github.com/peity/
License: MIT License
jStat is a statistical library written in JavaScript that allows you to perform advanced statistical operations without the need of a dedicated statistical language (i.e. MATLAB or R). The majority of jStat functions can be used independently of any other libraries. However, the plotting functionality of jStat is based on the jQuery plugin – flot.
jStat only uses elements that adhere to the jQuery UI ThemeRoller styles so any jQuery UI theme can be used. jStat was designed with simplicity in mind. Using an object-oriented design provides a clean API that can produce results in a few lines of code. jStat should work in all major browsers.

Requirements: jQuery Framework, Flot
Demo: http://www.jstat.org/
License: MIT License
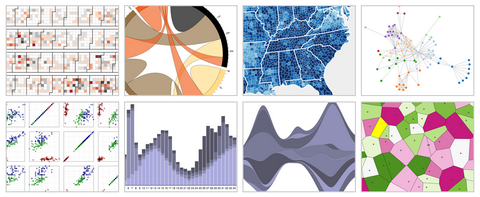
D3 is a small, free JavaScript library for manipulating HTML documents based on data. D3 can help you quickly visualize your data as HTML or SVG, handle interactivity, and incorporate smooth transitions and staged animations into your pages.
D3 is not a traditional visualization framework. Rather than provide a monolithic system with all the features anyone may ever need, D3 solves only the crux of the problem: efficient manipulation of documents based on data. This gives D3 extraordinary flexibility, exposing the full capabilities of underlying technologies such as CSS3, HTML5 and SVG. It avoids learning a new intermediate proprietary representation.

Requirements: Javascript Enabled
Demo: http://mbostock.github.com/d3/
License: License Free
Patrick Wied has shown us how to generates a real-time heatmap with javascript and the HTMLCanvas element depending on the user’s mouse movement.
It is also possible to save the image data of the heatmap. You just have to use the getData function, which returns a (long) data-URL of your heatmap image, to get it. This is especially useful for subsequent serverside processing or saving the image on the client.

Requirements: –
Demo: http://www.patrick-wied.at/static/heatmap/
License: License Free
The Linear Layout visualization is a productive approach to network visual analytics. It is a scalable, computationally fast, and straight-forward network visualization method that makes possible visual interpretation of network structure and evolution.
The linear layout method can be applied to data structures other than networks. Fundamentally, the method requires that your data structure can be mapped onto a set of pairwise relationships. The objects of each pair can be network nodes, but they can also be an interval or spatial position.
The power of the method is realized when you can classify your objects (e.g. assign them to an axis) and, for each object, compute a meaningful property (e.g. degree, to determine object position on the axis).

Requirements: –
Demo: http://mkweb.bcgsc.ca/linnet/
License: License Free


