Springy is a force directed graph layout algorithm. It means that springy uses some real world physics to try and figure out how to show a network graph in a way that looks good.
Springy.js is designed to be small and simple. It provides an abstraction for graph manipulation and for calculating the layout and not too much else. The details of drawing and interaction are mostly up to you. This means you can use canvas, SVG, WebGL, or even just plain old positioned HTML elements.

Requirements: JavaScript Framework
Download Link: http://getspringy.com/
License: MIT License
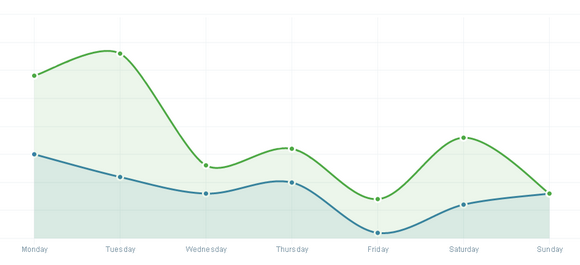
xCharts is a JavaScript library for building beautiful and custom data-driven chart visualizations for the web using D3.js. Using HTML, CSS, and SVG, xCharts are designed to be dynamic, fluid, and open to integrations and customization.
Since xCharts use SVG, we are able to accomplish most of our styling of xCharts directly through CSS. This means you have quite a bit of control to handle the visualization however you want. The best way to style charts is to start with the included stylesheet, or use your browser’s element inspector to see each elements CSS class selectors that are available to use.

Requirements: D3.js
Demo: http://tenxer.github.com/xcharts/
License: License Free
D3 Cloud is a Wordle-inspired word cloud layout written in JavaScript. It uses HTML5 canvas and sprite masks to achieve near-interactive speeds. This layout requires D3. It’s similar to d3.layout.force, in that it’s asynchronous and stateful.
The layout algorithm itself is incredibly simple. For each word, starting with the most “importantâ€: Attempt to place the word at some starting point: usually near the middle, or somewhere on a central horizontal line. If the word intersects with any previously-placed words, move it one step along an increasing spiral. Repeat until no intersections are found.

Requirements: D3 Framework
Demo: http://www.jasondavies.com/wordcloud/
License: License Free
BonsaiJS is a lightweight graphics library with an intuitive graphics API and an SVG renderer. The main features include Architecturally separated runner and renderer, iFrame, Worker and Node running contexts, Shapes, Paths, Assets (Videos, Images, Fonts, SubMovies), Keyframe and regular animation (easing functions too), Shape/path morphing, and much more…
Bonsai in its current form comes packaged with an SVG renderer. It supports browsers like Safari, Chrome and Firefox. It is released under MIT License.

Requirements: JavaScript Framework
Demo: http://bonsaijs.org/
License: MIT License
We live in an age of data. It’s now possible to collect all kinds of data – from website analytics to stats on your fitness and health. But now that we’re able to start collecting data like this, we often find that there’s too much of it – that there’s too much noise and not enough signal. And to make it even harder, our attention spans are getting shorter. We don’t want to spend time digging through the data to understand it, we want the answer immediately in front of us.
As data, and the analysing of huge volumes of information, becomes more and more important to us, it also becomes more important that the answers are presented in a meaningful, simple and useful way. Designs that display the data effectively and beautifully are more likely to be used again and again, and designs that are complicated, noisy and hard to use will be ignored.
We’ve brought together a showcase of innovative, stunningly beautiful dashboard concepts & designs to help inspire you. If you’re about to start a project that deals with data visualization, hopefully this collection will give you some inspiration into how you can show your information in a useful, simple and uncluttered way.
New Dashboard Line Graph

Chartbear Dashboard

Cutest Paw Dashboard

Minimal Dashboard

Read the rest of this entry »
JustGage is a handy JavaScript plugin for generating and animating nice & clean gauges. It is based on Raphaël library for vector drawing, so it’s completely resolution independant and self-adjusting. It works in almost any browser – IE6+, Chrome, Firefox, Safari, Opera, Android, etc.
JustGage auto-adjusts to the size of containing element. And to the screen zoom level. And screen density. Not digging default style? Then mock your own. JustGage features bunch of styling options including gauge width, gauge color and shadow, gauge level colors, colors for title, value, min & max etc.

Requirements: JavaScript Framework
Demo: http://www.justgage.com/
License: MIT License
Sigma.js is a free and open-source JavaScript library to draw graphs, using the HTML5 canvas element. It has been especially designed to share interactive network maps on a Web page or to explore dynamically a network database. It is distributed under the MIT License.

Requirements: JavaScript Framework
Demo: http://sigmajs.org/
License: MIT License
Crossfilter is a JavaScript library for exploring large multivariate datasets in the browser. Crossfilter supports extremely fast (<30ms) interaction with coordinated views, even with datasets containing a million or more records; it was built to power analytics for Square Register, allowing merchants to slice and dice their payment history fluidly.
Since most interactions only involve a single dimension, and then only small adjustments are made to the filter values, incremental filtering and reducing is significantly faster than starting from scratch. Crossfilter uses sorted indexes (and a few bit-twiddling hacks) to make this possible, dramatically increasing the perforÂmance of live histograms and top-K lists.

Requirements: D3
Demo: http://square.github.com/crossfilter/
License: Apache License 2.0
There are lots of timeline tools on the web but they are almost all either hard on the eyes or hard to use. The goal is to create timelines that are at the same time beautiful and intuitive for users.
Timeline is great for pulling in media from different sources. Just throw in a link from Twitter, YouTube, Flickr, Vimeo, Google Maps or SoundCloud and Timeline will format it to fit perfectly. More media types will be supported in the future. Creating one is as easy as filling in a Google spreadsheet or as detailed as JSON.

Requirements: jQuery Framework
Demo: http://timeline.verite.co/
License: GPL License
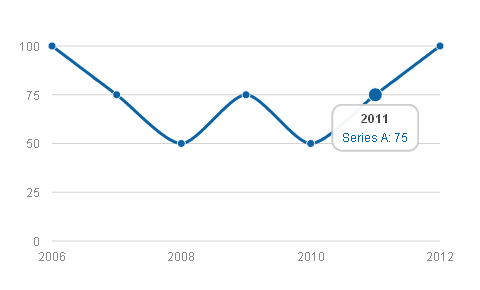
Morris.js is a lightweight library that uses jQuery and Raphaël to make drawing time-series graphs easy. Morris.js started life as the code that powered the graphs on howmanyleft.co.uk. Now it’s been open-sourced for the whole world to extend and enjoy.
It has been tested on IE6+, Safari/Chrome/Firefox, iOS 3+ and Android 3+. The public API is terribly simple. It’s just one function: Morris.Line(options), where options is an object containing many configuration options. And it is licensed under BSD License.

Requirements: jQuery and Raphaël Framework
Demo: http://oesmith.github.com/morris.js/
License: BSD License


