How to Diagnose JavaScript Errors Faster with Error.stack
Modern browsers like Internet Explorer 10 support for Error.stack, which enables Web developers to diagnose and correct bugs faster, especially those that are difficult to reproduce. Developers can build amazing apps with the capabilities of Web platforms that power today’s modern browsers as well as apps in Windows 8. The increasing power and complexity of these apps means developers need better tools like Error.stack for handling errors and diagnosing bugs. In this article, I’ll show you some simple debugging techniques to help save you time.

Debugging Applications
Structured error handling in JavaScript rests on throw and try/catch – where the developer declares an error and passes the control flow to a portion of the program that deals with error handling. When an error is thrown, Chakra, the JavaScript engine in Internet Explorer, captures the chain of calls that led up to where the error originated – also referred to as the call stack. If the object being thrown is an Error (or is a function whose prototype chain leads back to Error), Chakra creates a stack trace, a human-readable listing of the call stack. This listing is represented as a property, stack, on the Error object. The stack includes the error message, function names, and source file location information of the functions. This information can help developers rapidly diagnose defects by learning what function was being called, and even see what line of code was at fault. For example, it might indicate that a parameter passed into the function was null or an invalid type.
Let’s explore with an example of a simple script that attempts to calculate the distance between two points, (0, 2) and (12, 10):
(function () {

'use strict';

function squareRoot(n) {

if (n < 0)

throw new Error('Cannot take square root of negative number.');

return Math.sqrt(n);

}

function square(n) {

return n * n;

}

function pointDistance(pt1, pt2) {

return squareRoot((pt1.x - pt2.x) + (pt1.y - pt2.y));

}

function sample() {

var pt1 = { x: 0, y: 2 };

var pt2 = { x: 12, y: 10 };

console.log('Distance is: ' + pointDistance(pt1, pt2));

}

try {

sample();

}

catch (e) {

console.log(e.stack);

}

})();
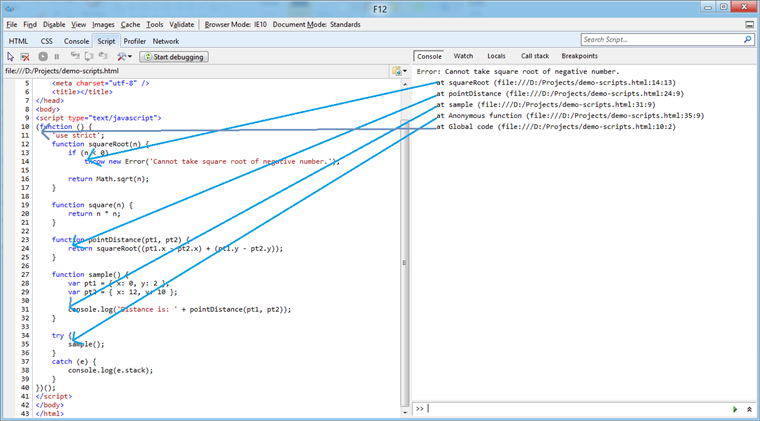
This script has a bug – it forgets to square the differences of the components. As a result, for some inputs, the pointDistance function will simply return incorrect results; other times, it will cause an error. To understand the stack trace, let’s examine the error in the F12 developer tools and look at its Script tab:

The stack trace is dumped to the console in the catch clause, and because it’s at the top of the stack, it’s readily apparent that the Error is originating in the squareRoot function. To debug the problem, a developer wouldn’t have to go very deep into the stack trace; squareRoot’s precondition was violated, and looking one level up the stack, it’s clear why: the sub-expressions within the call to squareRoot should themselves be parameters to square.
While debugging, the stack property can help identify code for setting a breakpoint. Bear in mind that there are other ways to view the call stack: for instance, if you set the script debugger to “Break on caught exception†mode, you may be able to inspect the call stack with the debugger. For deployed applications, you may consider wrapping problematic code within try/catch in order to capture failed calls, and log them to your server. Developers would then be able to look at the call stack to help isolate problem areas.
DOM Exceptions and Error.stack
I noted previously that the object being thrown must be an Error or lead back to Error via its prototype chain. This is intentional; JavaScript supports throwing any object and even primitives as exceptions. While all of these can be caught and examined, they are not all specifically designed to contain error or diagnostic information. As a consequence, only Errors will be updated with a stack property when thrown.
Even though DOM Exceptions are objects, they don’t have prototype chains that lead back to Error, and therefore they don’t have a stack property. In scenarios in which you are performing DOM manipulation and want to surface JavaScript-compatible errors, you may want to wrap your DOM manipulation code within a try/catch block, and throw a new Error object within the catch clause:
function causesDomError() {

try {

var div = document.createElement('div');

div.appendChild(div);

} catch (e) {

throw new Error(e.toString());

}

}
However, you will probably want to consider whether you want to use this pattern. It is likely best-suited for utility library development; specifically, consider whether your code’s intent is to hide DOM manipulation, or to simply carry out a task. If it is hiding DOM manipulation, wrapping the manipulation and throwing an Error is probably the right way to go.
Performance Considerations
The construction of the stack trace begins when the error object is thrown; doing so requires walking the current execution stack. To prevent performance problems in traversing a particularly large stack (possibly even a recursive stack chain), by default, IE only collects the top 10 stack frames. This setting is configurable, however, by setting the static property Error.stackTraceLimit to another value. This setting is global, and must be changed prior to throwing the error, or else it will not have an effect on stack traces.
Asynchronous Exceptions
When a stack trace is generated from an asynchronous callback (for example, a timeout, interval, or XMLHttpRequest), the asynchronous callback, rather than the code that created the asynchronous callback, will be at the bottom of the call stack. This has some potential implications for tracking down offending code: if you use the same callback function for multiple asynchronous callbacks, you may find it difficult to determine by inspection alone which callback caused the error. Let’s slightly modify our previous sample so that, instead of calling sample() directly, we’ll put that into a timeout callback:
(function () {

'use strict';

function squareRoot(n) {

if (n < 0)

throw new Error('Cannot take square root of negative number.');

return Math.sqrt(n);

}

function square(n) {

return n * n;

}

function pointDistance(pt1, pt2) {

return squareRoot((pt1.x - pt2.x) + (pt1.y - pt2.y));

}

function sample() {

var pt1 = { x: 0, y: 2 };

var pt2 = { x: 12, y: 10 };

console.log('Distance is: ' + pointDistance(pt1, pt2));

}

setTimeout(function () {

try {

sample();

}

catch (e) {

console.log(e.stack);

}

}, 2500);

})();
Upon executing this snippet, you’ll see the stack trace come up after a slight delay. This time, you’ll also see that the bottom of the stack is not Global Code but rather is Anonymous function. In fact, it’s not the same anonymous function, but the callback function passed into setTimeout. Since you lose the context surrounding hooking up the callback, you may not be able to determine what is causing the callback to be called. If you consider a scenario in which one callback is registered to handle the click event of many different buttons, you will be unable to tell to which callback the registration refers to. That being said, this limitation is only minor, because, in most cases, the top of the stack will likely highlight the problem areas.
Exploring the Test Drive Demo

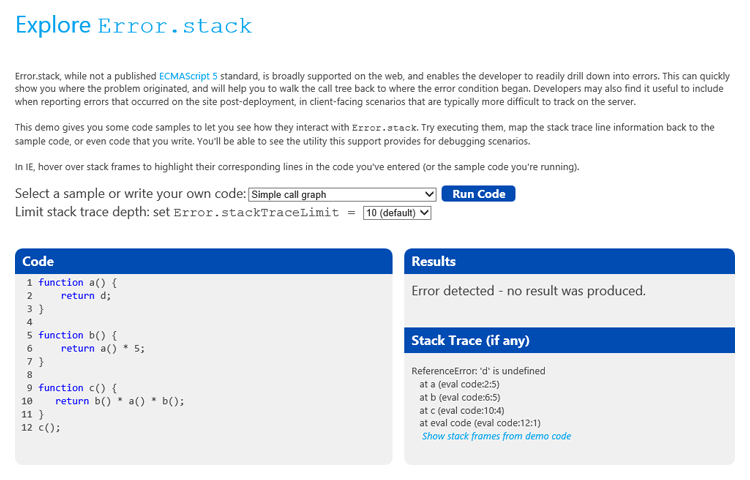
Check out this Test Drive demo using IE10 in the Windows 8 Release Preview. You can execute code in the context of an eval and if an error occurs, you’ll be able to inspect it. If you’re running the code within IE10, you’ll also be able to highlight the lines of your code as you hover over the error lines in the stack trace. You can type code into the Code area yourself, or select from several samples in the list. You can also set the Error.stackTraceLimit value when running the code samples.
For reference material, you may want to cruise over to the MSDN documentation for Error.stack as well as stackTraceLimit.
About the Author
Rob Paveza is a Program Manager in the Internet Explorer team that specializes in Chakra, the new JavaScript Runtime engine.


