How to Create Professional 3D Pie Charts in Illustrator
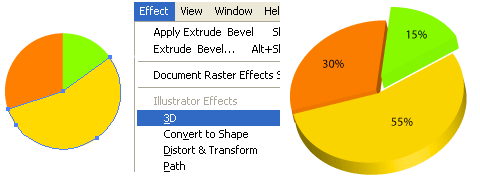
Are you still using the traditional 2D graph for your reports and presentations? N.Design Studio taught us how to create 3D Pie Charts with Illustrator CS2 at ease. The Pie Charts looks so real and professional.
As a freelancer, we may come into the situation that you have to present some sort of statistical data to your client. Of course you may use Excel’s graph tool to easily create a bunch of charts, but more or less all of those predefined designs suck. Bartelme Design show us how to create visually appealing Pie charts using Adobe Illustrator’s graph tool.
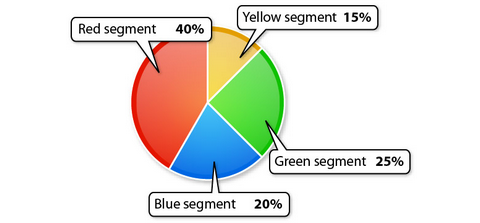
GoSquared showed us how to create beautiful Pie Charts in Illustrator. Just follow a few simple steps, and you’ll view pie charts in a whole new light.
IMmodernLife created a comprehensive tutorial of how to make overwhelming niceness of the Pie Charts. He is using Adobe Illustrator CS2, but the tips should apply to most of the more recent versions.
Requirements: Adobe Illustrator
Demo 1: http://www.ndesign-studio.com/resources/tutorials/3d-graphs/”
Demo 2: http://bartelme.at/journal/archive/creating_graphs/journal/281/
Demo 3: http://www.gosquared.com/liquidicity/archives/103
Demo 4: http://www.modernlifeisrubbish.co.uk/article/howto…
License: License Free


