Using the Windows 8 Simulator & VS 2012 to Debug
I’m currently working around the touch events of IE10 and even if I’m lucky enough to have a Windows 8 tablet, I was looking for a simpler way to do basic tests on my classical laptop without switching to the tablet each time. While looking for that, I’ve discovered several tips & tricks that may help you debugging the IE10 touch events in your code without even using a touch device. Nice side effect: the same approach will also help you to test & debug your responsive web design!
Pre-requisites: to follow this tutorial, you need first to:
1 – Download & install Windows 8 Release Preview on your machine: http://preview.windows.com
2 – Download & install Visual Studio 2012 RC Express for Windows 8: http://msdn.microsoft.com/en-us/windows/apps/br229516
The touch events model of Internet Explorer 10
If you don’t know yet how our touch implementation works, you should first read these 3 articles:
- Touch Input for IE10 and Metro style Apps
- Handling Multi-touch and Mouse Input in All Browsers
- Go Beyond Pan, Zoom, and Tap Using Gesture Events
As a complement resource, you may have a look to the Pointer.JS library that mimics the IE10 model for the other browsers.
The Windows 8 Simulator to simulate touch
The Windows Simulator is installed with the development tools and is normally designed to help you testing & debugging your Metro Style Apps. You may learn a bit more details here: First look at Windows Simulator
Still, nothing prevents us to use it for debugging web applications running inside IE10 in the simulator. Let me show you how.
1 – Launch the simulator by launching the Microsoft.Windows.Simulator.exe located inside “Program Files (x86)\Common Files\Microsoft Shared\Windows Simulator\11.0â€
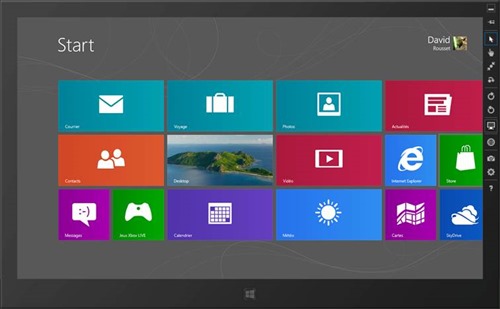
And click on the desktop icon.
2 – Launch IE10, navigate to the “Internet Options†and “Advanced†tab. Check that both “Disable script debugging (Internet Explorer)†& “Disable script debugging (Other)†are not checked:
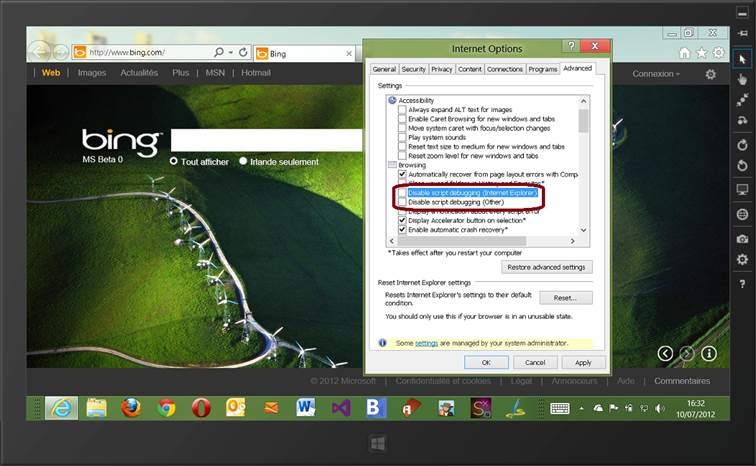
3 – Navigate to the URL you’d like to test and/or debug. For instance, let’s test this demo: Finger Painting from the IE Test Drive. Using the simulator, you can simulate classical mouse input and/or touch switching modes using 2 pointer buttons:
First, you’ll think you’ll get the exact same results:
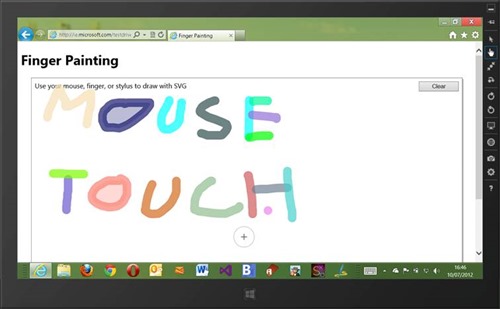
But clicking on zooming button
will show you that you have a dual touch simulation for zooming & rotating:
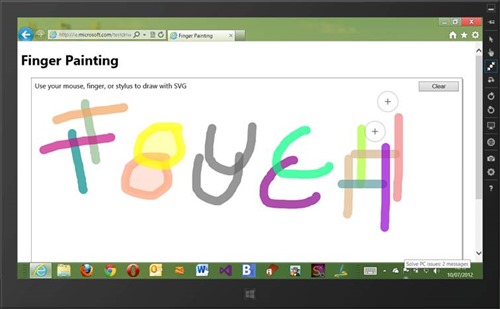
These dual touch features are more interesting to use with such demos: Browser Surface
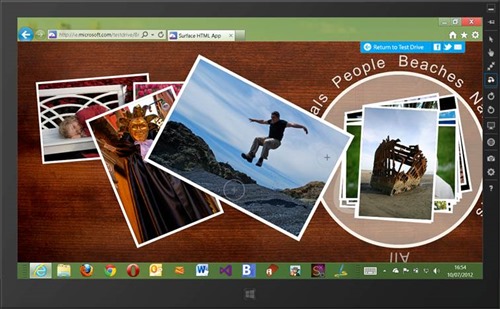
Using the simulator, you’ll be able to simulate zoom & rotation via touch gesture.
Visual Studio 2012 to debug the JavaScript code
If you’d like to go deeper in the testing & debugging of your touch experience, you’ll probably need to debug your JavaScript code. The first obvious solution is to press the F12 key to use the IE10 developer tools. But working in the smaller window of the simulator with the F12 key is not very comfortable.
Another great solution is then to use the debugger of Visual Studio 2012. Here are the steps to follow for that:
1 – On your main session (outside of the simulator), launch Visual Studio 2012 RC Express and navigate to “DEBUG†–> “Attach to Process…â€
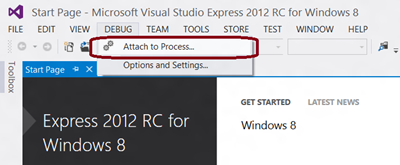
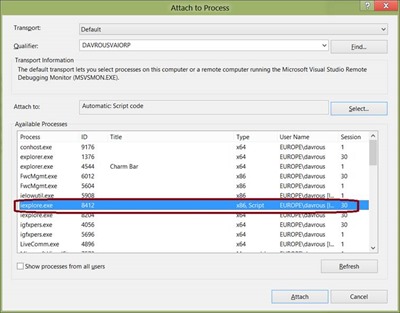
2 – Locate the “iexplorer.exe†process (of type “x86, Scriptâ€) to attach to:
3 – If everything goes fine, you should have this result using the Browser Surface demo:
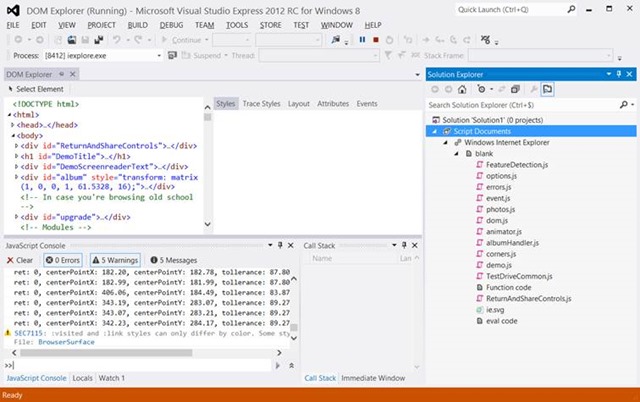
If it’s not the case, you’ve probably attached to the wrong iexplore.exe process or you’ve forgot to uncheck the disable script debugging options.
If you’ve chosen the right process, you will see all the JavaScript files in the right pane named “Solution Explorer†under the node named “Script Documentsâ€.
4 – Let’s then first concentrate our efforts on the JavaScript debugging experience. Open for instance the “demo.js†file and add a breakpoint on the line 136: if (Options.inertiaBounce()) { :
5 – Take an image and throw it using the touch simulation, it should automatically break into Visual Studio:
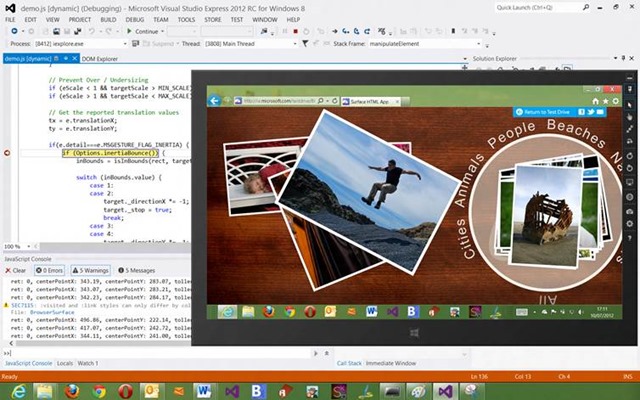
You can then step into the code, view the JavaScript console output, jump directly to the definition of a function by right clicking on it, etc. Well, you’ll have a very advanced debugging experience!
In conclusion, you can entirely debug your JavaScript touch logic to support IE10 without any touch device. Of course, you’ll need to test your final code & web app on a real touch device to have a perfect idea on how your code will behave in real conditions. But still, this approach could help you and save you time.
Testing & Debugging your Responsive Design
The Simulator and VS 2012 could be also some good friends to help you testing & debugging your responsive design. Let’s start by reviewing what the simulator has to offer for that.
I’ve searched on the web for the best websites implementing responsive design principles. I’ve chosen to use this one: http://garretkeizer.com/ for the following screenshots. You can find other cool websites to test on: http://mediaqueri.es
Here is the design of his website in Internet Explorer 10 using the default settings of the simulator:
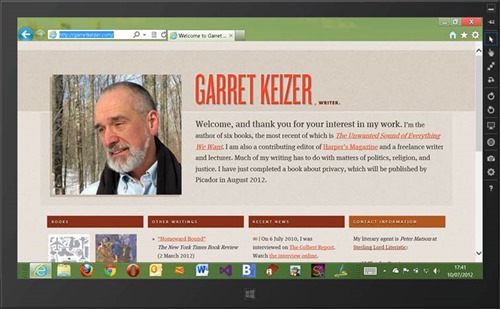
Let’s now review some cool options of the simulator to go further.
1 – You can test how the design change in portrait or landscape mode by clicking on refresh buttons:
Here is the result for the chosen website:
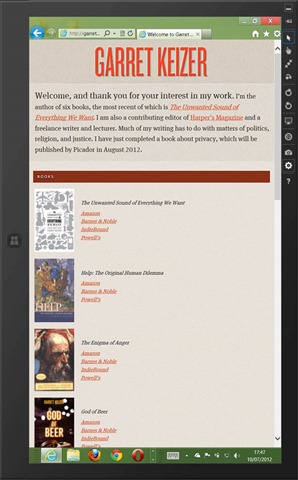
2 – You can also simulate various forms factors and resolutions displays by clicking on this button:
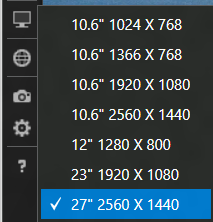
3 – Here is the result of the same website in 2560×1440 (compared to the default 1366×768 of previous screenshots):
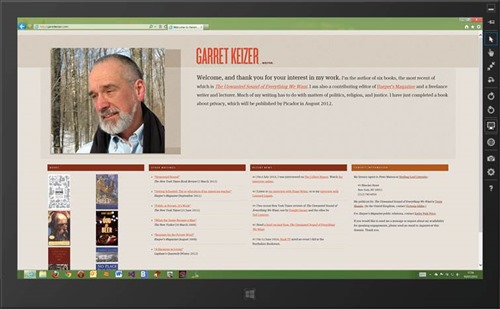
4 – Now if you want to go even further, you can use the awesome DOM Explorer tool of VS 2012 to help you reviewing & live editing your CSS. For instance, once the debugger is attached, you’ll see a window named “DOM Explorerâ€. While your mouse is hovering the HTML node, you’ll see in live the various areas highlighted in the simulator:
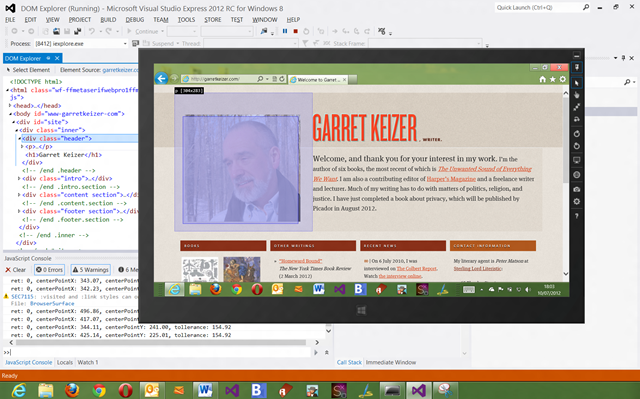
And of course, you’ll be able to review, edit & trace your styles in Visual Studio to potentially fix your CSS design.
I hope that these little tricks will help and save some of you time. You should then keep an eye on these free tools!
About the Author
David Rousset is a Developer Evangelist at Microsoft, specializing in HTML5 and web development. Read his blog on MSDN or follow him @davrous on Twitter.


