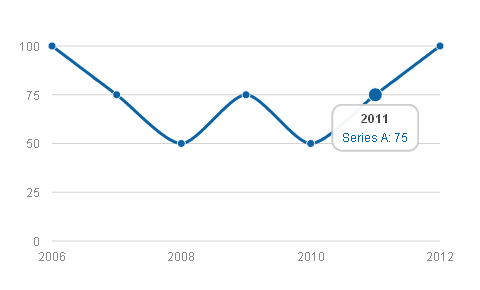
Drawing Pretty Time-Series Line Graphs with Morris.js
Posted · Category: BSD License, Charts
Morris.js is a lightweight library that uses jQuery and Raphaël to make drawing time-series graphs easy. Morris.js started life as the code that powered the graphs on howmanyleft.co.uk. Now it’s been open-sourced for the whole world to extend and enjoy.
It has been tested on IE6+, Safari/Chrome/Firefox, iOS 3+ and Android 3+. The public API is terribly simple. It’s just one function: Morris.Line(options), where options is an object containing many configuration options. And it is licensed under BSD License.
Requirements: jQuery and Raphaël Framework
Demo: http://oesmith.github.com/morris.js/
License: BSD License
0 Comments


