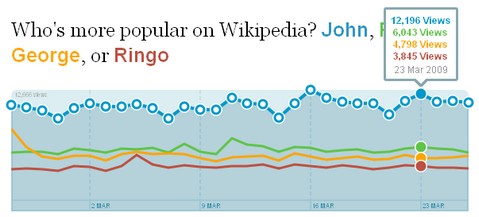
Wikirank shows you what people are reading on Wikipedia. It’s based on the actual usage data from the Wikipedia servers, which the Wikimedia foundation makes available as a public service. They take that data, process it, and give it back to you in a format that’s easy to use and share. Wikirank reveals emerging trends, and lets you embed relevant charts in blog posts and on social media sites.
From a technical perspective, the charts on Wikirank are based on logs from Wikipedia’s HTTP Squid proxy servers. That means every single page load is recorded, whether initiated by a human with a browser or a Web spider crawling through. Therefore, the numbers for a topic on a particular day can’t be considered absolute impressions the way, say, an ad server might count them.
The data of Wikirank indicates relative increases or decreases, so the shape of the charts is more important than the specific number of views. Comparisons are even more interesting, as relative interest in multiple topics can be ranked.

Requirements: –
Demo: http://wikirank.com
License: GFDL License
GoView made screen recordings easy. You can start recording your computer’s screen and audio with just two clicks. Snipping out unwanted segments is as simple as using a pair of scissors. You can also insert title slides to add polish and act as section dividers. After all, your recording is instantly ready to be viewed an share online. It’s quick. It’s easy. And it’s free.

Requirements: Firefox 2.0+, Internet Explorer 6.0, 7.0
Demo: http://goview.com/
License: License Free
OmniGrid is an advanced DataGrid based on Mootools, developed by Marko Å antić from Omnisdata Ltd. It is inspired by two similar components: FlexGrid jQuery and phatfusion:sortableTable and partly use their source code. It’s developed because of lack of powerful DataGrid for Mootools 1.2 library. OmniGrid is licensed under a Creative Commons Attribution 3.0 Unported License.

Requirements: Mootools Framework
Demo: http://www.omnisdata.com/omnigrid/
License: Creative Commons 3.0 License
TinEye is a reverse image search engine. You can submit an image to TinEye to find out where it came from, how it is being used, if modified versions of the image exist, or to find higher resolution versions. TinEye is the first image search engine on the web to use image identification technology rather than keywords, metadata or watermarks.
When you submit an image to be searched, TinEye creates a unique and compact digital signature or ‘fingerprint’ for it, then compares this fingerprint to every other image in their index to retrieve matches. TinEye can even find a partial fingerprint match.
TinEye does not typically find similar images; it finds exact matches including those that have been cropped, edited or resized. I have found TinEye very useful, you can easily find out who has stolen your images from your website or portfolio. You can see how powerful TinEye is by checking out their search examples.

Source: http://tineye.com/
Cufón is similar to Typeface.js which aims to become a worthy alternative to sIFR, and despite its merits still remains painfully tricky to set up and use. Cufón consists of two individual parts as well – a font generator, which converts fonts to a proprietary format and a rendering engine written in JavaScript.
It works on every major browser on the market. There is near-zero configuration needed for standard use cases. And it is fast, even for sufficiently large amounts of text.

Requirements: Canvas and VML
Demo: http://cameronmoll.com/archives/2009/03/cufon_font_embedding/
License: License Free
Protovis is a visualization toolkit for JavaScript using the canvas element. It takes a graphical approach to data visualization, composing custom views of data with simple graphical primitives like bars and dots. These primitives are called marks, and each mark encodes data visually through dynamic properties such as color and position. Although marks are simple by themselves, you can combine them in interesting ways to make rich, interactive visualizations.
To facilitate this, Protovis supports panels and inheritance. A panel is a container for marks; the contained marks are replicated for each data point on the panel. You can vary the panel position to create small multiple displays, or you can overlay panels. Inheritance lets you derive new marks from existing ones, while sharing some or all of the same properties. This is the same principle as cascading in CSS, or prototypal inheritance in JavaScript.
Please note: Protovis is in its early stages of development. At the moment, they only support Firefox 3, but they plan on adding support for Chrome and Safari 4.

Requirements: Firefox 3
Demo: http://vis.stanford.edu/protovis/ex/
License: BSD License
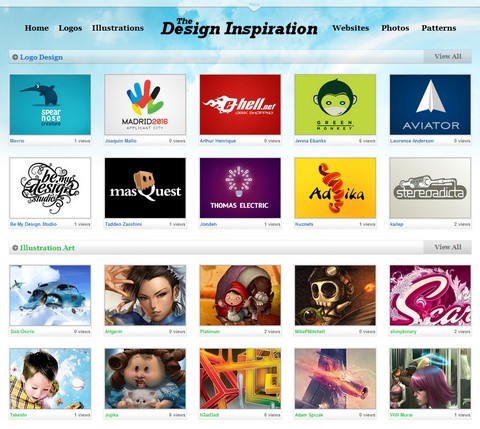
The Design Inspiration is created by a group of designers who are seeking various design inspiration every day. To make every designer’s life easier, they have decided to feature some of the best logo designs, illustration art, websites, photos and patterns from the most talented designers around the world. The site updates every day, so that you can get the fresh and top quality design inspiration daily.

Source: http://thedesigninspiration.com/
Susumu Yoshida is a visual interface designer in Japan. He has created a set of iPhone style sidebar icons for us. They are 16px icons in PNG format. Of course, it is not restricted to use these icons on your sidebar. If you think it is suitable to use them on your blogs or web applications, you are free to do so as well.

Requirements: –
Demo: http://macthemes2.net/forum/viewtopic.php?id=16794062
License: License Free
Are you interested in developing some plugins for Chrome too? We have seen lots of browser plugins for Firefox at the moment, it would be nice if we can see some nice plugins for Chrome as well.
Matt Cutts, the head of Google’s Webspam team, has published an article about “How to Write a Chrome Extension in Three Easy Steps“. Here is a brief introduction of how to write your own Google Chrome extension in three steps:
1. Install the developer-channel version of Google Chrome
It takes maybe 3-4 minutes, you basically run a small program to indicate your preference. The developer version also gets new features (such as pressing “F11″ to get full-screen mode) way before the beta/stable releases of Chrome.
2. Read the initial documentation
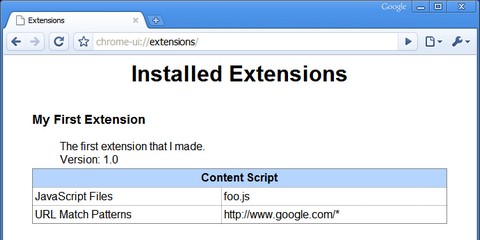
Extensions currently have very Greasemonkey-like functionality: you identify which web pages should be modified, plus JavaScript to be added to those pages. Your plugin has to have a unique identifier. And you have to bundle your extension directory into a “.crx†Chrome Extension file.
3. Try it out
If you’re running the developer version of Chrome, you can install the “hello world†plugin from the extension howto page just by clicking to download the .crx file. Then type “chrome-ui://extensions/†.

Source: How to Write a Chrome Extension in Three Easy Steps
Every web developer today faces the challenge of checking website compatibility across a large pool of browsers and browser versions in the marketplace. Up and until now, either you could install every browser, verify the website via a visual inspection and debug with tools specialized to that browser, or you could send a URL to a third-party screenshotting service like BrowserShots for an all-in-one visual inspection.
The former is messy and tedious but gives you more control and an opportunity to diagnose problems, whilst the latter is simple but slow and useless to fix the problem. Long Zheng has shown us SuperPreview is the best of both worlds.
SuperPreview as a tool allows you to compare different rendering engines in a single unified interface. Simple clicks gives you comparisons between Internet Explorer 6, the native version of Internet Explorer installed, other browsers you may have installed locally – Firefox 3.5, Safari 3, Safari 4 – and even an bitmap images of website prototypes.

Source: Expression Web SuperPreview


