WebAppers

/ best free open source web resources /

Graphic Resources

Improving your WordPress tables with the #1 plugin for tables and charts

Posted · Category: Best Collections

One of the typical tasks almost each site creator eventually needs to solve is a requirement to display huge amounts of data to the site visitors in a readable and interactive manner. A classic solution is organising the data in a table.

If you deal with data management on your website, you should know about wpDataTables. This is the number one WordPress plugin for tables and charts. wpDataTables takes any amount of data and organizes it on your website. It does so quickly and efficiently so you can avoid five major issues.


Major Issue #1: Wasting time organizing data

Putting together a price list or product catalog on your site can be time-consuming. You will sometimes need to manually craft a table or chart. Then, you might need to align it to fit the page, and then to pour in all the data to form neatly organized columns. This process can be a giant waste of time.

Solution: wpDataTables will spare you a lot of time as well as frustration! It will manage your data for you in a matter of minutes.

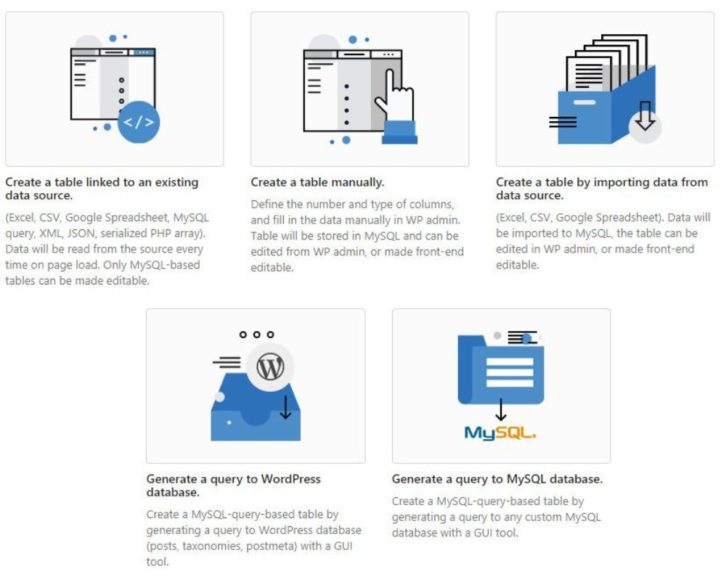
For example, you might already have a table in Excel, Google Spreadsheet or MySQL. In this case, you can create a table on your WordPress site with wpDataTables in a couple of clicks.

1

2

Or, by clicking Add New you can have a new table in two seconds flat. After that, all that is left is organizing your data and optimizing your design with just a few clicks.

Here is exactly what you can do.

  • Use any type of input source. This can be MySQL, Excel, CSV, Google Spreadsheet, XML, JSON or Serialized PHP array
  • Upload files, no matter how complex or massive it is
  • Copy, save to Excel or save to CSV (Table tools feature)
  • Sort your tables (Enable sorting feature)
  • Limit the table’s width (Limit table layout feature)
  • Define how many entries are displayed on a page (Display length feature)
  • Calculating the sum, average, maximum or minimum of all values in numeric columns (Calculation functions feature)
  • Use foreign keys for MySQL-based tables.
  • Preview your table to make sure the structure is flawless (Preview feature)

Major Issue #2: Needing five different plugins

Typically, you would need multiple plugins when you work with complex data. That means time spent learning how each and everyone works.

It might be hard to figure out the strengths and weaknesses of different plugins. What is more, merging them is a huge headache. Some plugins may cause conflicts when installed on same WordPress installation.

Solution: Using wpDataTables you can create and organize your information anyway you want.

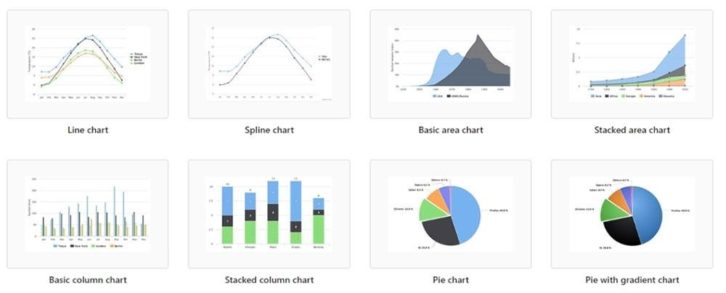
You can also use the built-in Chart Creation Wizard to turn your data into a graph or chart. It only takes a few clicks.

3

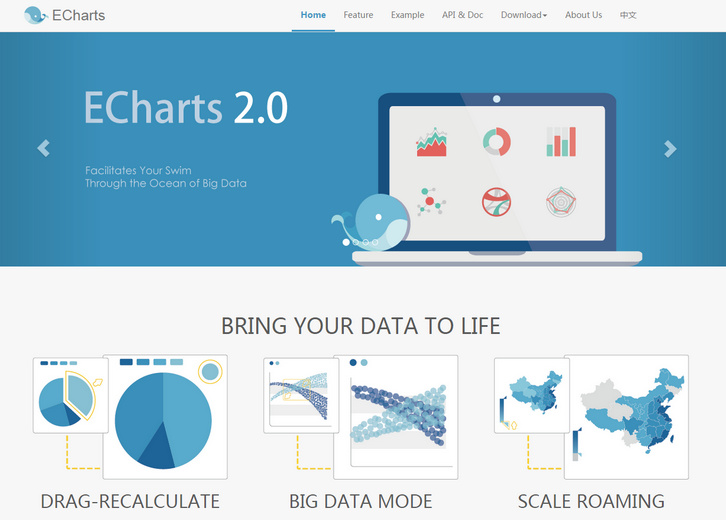
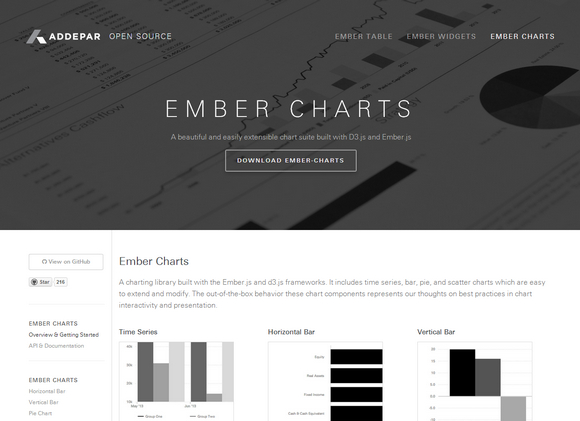
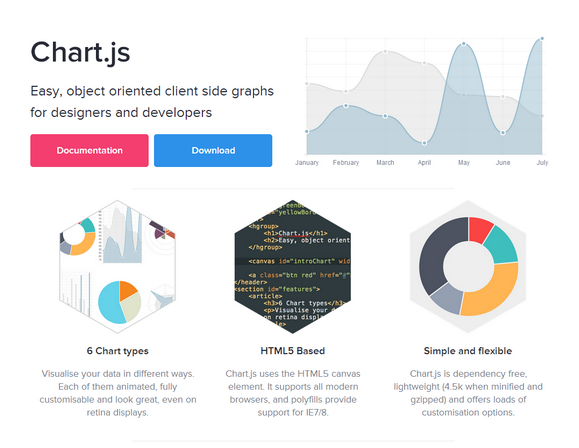
Three render engines can be used; Google Charts, Highcharts, and Chart.js. Also, you can easily insert a form on your website. To do this, you can take advantage of a wpDataTables add-on that integrates Gravity Forms.

4

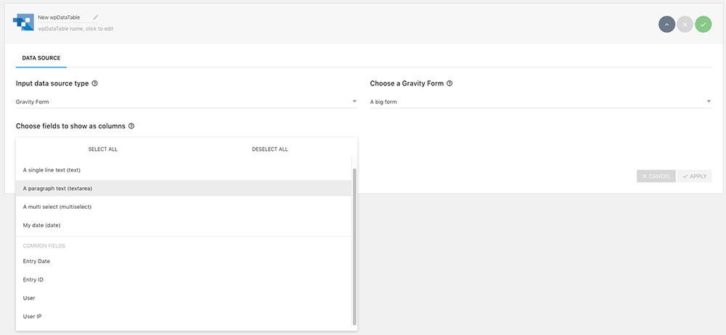
Here are some of the most appreciated features of the Gravity Forms integration add-on.

  • Show any form fields as table columns.
  • Display all the entry’s additional information (IP, DateTime, User ID) in a table.
  • Configure the output (display all records, only last XX records etc)
  • Show or hide deleted entries.
  • Use all of wpDataTables power once you create the form – sort, search, filter, and navigate through Gravity forms data as through any other wpDataTable.

Major Issue #3: Ruining the design of your website

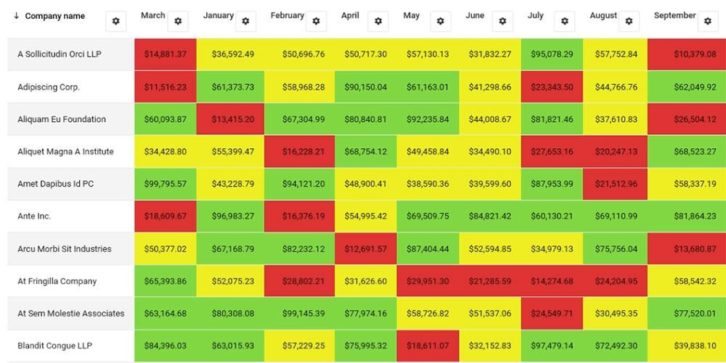
Adding a major amount of data can compromise the design of your site. The design is the first thing to go when organizing a large quantity of data. Often you risk a well-organized, but an ugly-looking table that takes over your site.

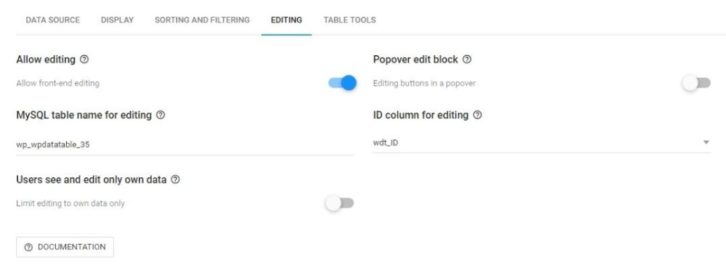
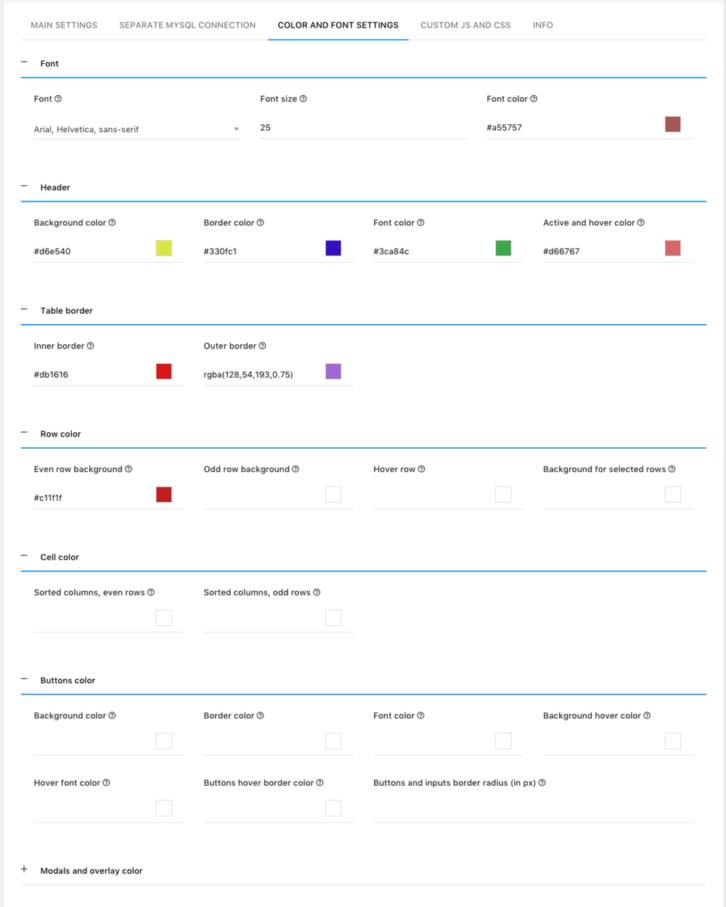
Solution: wpDataTables allows you to adjust the table design to your liking.

5

You can do a lot with wpDataTables for matching your style. This includes quick colors, font size, editing columns to its appropriate type.

6

Major Issue #4: Having a hard time navigating the data

The most important thing in data management is easy navigation.

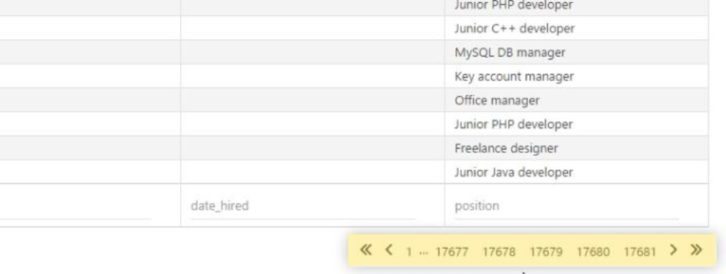
You want any visitor to your website to be able to find the precise thing they are looking for. Even if you have millions of rows.

Solution: wpDataTables has put extra effort into the filtering features. This allows creating an easy and intuitive navigation experience.

7

What you can do with the plugin:

  • Display a filter below each column (Advanced filtering feature)
  • Create a filter within the form (Filter in the form feature)

If you wish for an even better navigation and filtering experience you can use Powerful Filters. A multifunctional addon. It will extend default functionalities in several ways.

  • Cascade Filtering – filter values in order from left to right. Selection in each filter will enable next one and narrow down the options in it.
  • Independent Cascade Filtering. Lose the restriction to define filter values from left to right. Any filter narrows down all others.
  • Hide Table before filtering – keep the table hidden until a selection is made in the filter.
  • Search Button – make the table apply filters only when the Search button is clicked.

Major Issue #5: Taking forever to load a page due to the massive amount of data

The trouble is that loading a page with a large amount of data can take forever. All your efforts to organize your massive data will be for nothing if it takes a long time to load. No one wants to wait longer than a few seconds before they move on from your page.

Solution: wpDataTables automatically creates responsive mega tables.

Here’s what you can do, even with a huge amount of data:

  • Display your table differently on various devices. (Responsive feature)
  • Hide table until full page is loaded. (Optional feature)
  • Scroll the table horizontally (Scrollable feature)

Do you think wpDataTables is for you?

8

With wpDataTables, you never have to worry about writing code. 16,000 people have chosen this plugin because of its time-saving functionality. Even without tech skills, it is rated high as an easy to use the plugin. So, if you need to gather and publish data in all its forms, you can easily use wpDataTables to manage them.

You can use the plugin to create and organize:

  • Price lists
  • Product catalogues
  • Product/price comparisons
  • Event rundowns
  • Data collection
  • Inventories

Why waste time with messy, ugly charts when you can use this simple plugin and addons? All the headache causing tech issues can be removed from your day.

wpDataTables relieves the struggle of displaying massive amounts of data. There will be no need to compromise load speed, navigation or design. You can have the website of your dreams with less mess and fuss.

Create Interactive and Responsive Tables and Charts with WpDataTables

Posted · Category: Best Collections

The need to manage huge amounts of website data can become a formidable task. One you generally don’t look forward to. It’s just not numbers either. Statistics, labels, categories, and other important data types often come into play.

An obvious solution is to invest in a data management tool or plugin.  Unless what you buy is intuitive to use, you may have to put everything else on hold while you figure out how it works.

wpDataTables is so easy to use, that you might be fooled into thinking that this plugin can read your mind to see what you want done. That’s not really the case of course.  Still, with wpDataTables you can organize any amount of data into interactive, responsive, and easily editable tables and charts.  And you can do this without any need for coding whatsoever.

1. Exciting New wpDataTables 2.0 Features

wpDataTables 2.0 brings more than 20 new features to the table, along with major improvements in many of the more popular 1.0 features – in response to what customers have asked for.

The wpDataTables team improved the plugin, not only by the addition of new features, but by fixing several small bugs, and doing what was needed to make this easy-to-use tool, even easier to use. Read the rest of this entry »

Chartd – Responsive and Retina-Compatible Charts

Posted · Category: Charts, License Free

At StatHat, they make a lot of charts. They creates dynamic, autoupdating charts using JavaScript, but we also send charts via email and to external services like Campfire and Slack. Plus, they let users embed charts on their own web pages. For these situations, JavaScript charts either won’t work, are overkill, or could get messy.

So they made chartd. It allows you to create a chart with just an img tag. These charts:

  • are responsive (resize this page to see the charts respond)
  • are retina-friendly
  • can contain up to 5 datasets
  • can be line or step charts
  • have customizable colors and strokes

No JavaScript is required. You can generate SVG or PNG charts. We prefer SVG, but some services (like gmail) won’t render SVGs in emails.

chartd

Requirements: –
Demo: http://chartd.co/
License: License Free

ECharts – Comprehensive Charting Library for Everything

Posted · Category: Charts

ECharts is a comprehensive charting library offering a painless way of adding interactive charts to your commercial products. On the foundation of ZRender-based (a whole new lightweight canvas library) coordinate system, legend, tooltip, toolbox and other basic components, ECharts currently supports line, column, scatter, pie, radar, candlestick, chord, gauge, funnel, map and force-directed chart types, many of these can be combined in one chart.

It’s compatible with most common browsers — including IE6/7/8/9+, Chrome, Firefox, Safari and Opera. Compared with a single chart, a combination of charts can be more expressive and more interesting. ECharts supports any combination of any chart provided herein (a total of 11 types and 17 subtypes).

echarts

Requirements: JavaScript Framework
Demo: http://ecomfe.github.io/echarts/index-en.html
License: Copyright (c) 2013, Baidu Inc

Free Download: 72 Website Flowcharts and Wireframes

Posted · Category: License Free, PS Tutorials

Professional flowcharts within minutes, it is possible if you have a proper assets in your designer toolbox! Meet UI Tiles, 72 Website Flowcharts for any purpose. Build site maps, demonstrate interactions and engineer magnificent projects, saving lots of time and energy.

Whether you’re a developers, designer or any other person involved in Web Design related projects, you can freely use UI Tiles since they go in every popular vector formats (PSD, AI, Sketch) and PNG formats.

ui-tiles

Requirements: –
Demo: http://pixelbuddha.net/ui-tiles/
License: License Free

Free Download: Charts and Diagrams Kit (PSD)

Posted · Category: CC License, Charts, MIT License

Both diagrams and charts are pictorial representations of information. Both are used to communicate visually, and both try to simplify the information they’re conveying. They’re also a great way to track trends and help explain complex datasets.

Have you ever encounter situations where you need to create a simple yet good-looking chart? That’s why we have created this Charts and Diagrams Kit, containing some of the most popular chart elements, which will help you design charts and graphs in Photoshop with ease. It includes bar chart, line chart, pie chart, timeline chart, circular chart, stats chart, map chart, slider and etc. Best of all, it’s free for download in PSD format.

charts-graphs-1

Read the rest of this entry »

Ember Charts – Charting Library Built with Ember & D3

Posted · Category: Charts, License Free

Ember Charts is a charting library built with the Ember.js and d3.js frameworks. It includes time series, bar, pie, and scatter charts which are easy to extend and modify. The out-of-the-box behavior these chart components represents their thoughts on best practices in chart interactivity and presentation.

It is highly customizable and extensible. You can add legends, labels, tooltips, and mouseover effects. You can also roll your own charts by extending our ChartComponent class – get labels, automatic resizing, and reasonable defaults for margins, padding, etc.

ember-charts

Requirements: D3.js and Ember.js
Demo: http://addepar.github.io/#/ember-charts/
License: License Free

How to Build Live NASDAQ Bar Charts without Plugins

Posted · Category: Charts, Information

In this article, we’ll get rolling on developing plug-in free by creating bar graphs and similar graphics, using NASDAQ’s current web site as an example. But we won’t be creating merely a picture of a bar graph, but a real, interactive bar graph. Let’s take a look at an existing site that uses Flash, then build one using HTML5.

If you have Flash installed, you’ll see a fancy line chart. You can float your mouse over the line and see a small popup showing the stock price at that point, along with the volume of trading, like so:

If you don’t have Flash installed, then the site just shows you a graphic image. So you’re not left out completely without Flash, but with HTML5, we can include everybody.

Now, we’ll build something similar. To keep this article from getting too long, let’s just show the data in a box below the graph. But as you move the mouse along the graph, or touch it on a tablet, it will highlight the closest point on the graph, and show the information for that point in a box. Here’s what the final product will look like: Read the rest of this entry »

Chart.js – HTML5 Charts for Designers & Developers

Posted · Category: Charts, MIT License

Chart.js is an easy, object oriented client side graphs for designers and developers. You can visualise your data in 6 different ways. Each of them animated, fully customizable and look great, even on retina displays. Chart.js uses the HTML5 canvas element. It supports all modern browsers, and polyfills provide support for IE7/8.

Chart.js is dependency free, lightweight (4.5k when minified and gzipped) and offers loads of customization options. it is licensed under MIT License.

chart-js

Requirements: HTML5 Framework
Demo: http://www.chartjs.org/
License: MIT License

Pretty Ajax Charts with xCharts, jQuery and MySQL

Posted · Category: Charts, License Free

Charts are a great visual aid when presenting data. You can’t build a professional admin panel without them. They are also tricky to set up. However, there is a new library that makes things easier – xCharts.

TutorialZine has published an article: Make Pretty Charts for Your App with jQuery and xCharts, that used xCharts along with the daterange picker for Twitter Bootstrap, to build a pretty, AJAX-powered chart for your web application that fetches data from a MySQL table.

charts-web-app

Requirements: JavaScript and MySQL
Download Link: http://demo.tutorialzine.com/2013/01/charts-jquery-ajax/
License: License Free

Page 1 of 10123456789»...
Supported By

Deals

Web Browsers Icon Set
Food Icon Set
Flat Icon Set

Flat Icon Set

100 icons