A Showcase of Innovative Data Visualization Concepts
We live in an age of data. It’s now possible to collect all kinds of data – from website analytics to stats on your fitness and health. But now that we’re able to start collecting data like this, we often find that there’s too much of it – that there’s too much noise and not enough signal. And to make it even harder, our attention spans are getting shorter. We don’t want to spend time digging through the data to understand it, we want the answer immediately in front of us.
As data, and the analysing of huge volumes of information, becomes more and more important to us, it also becomes more important that the answers are presented in a meaningful, simple and useful way. Designs that display the data effectively and beautifully are more likely to be used again and again, and designs that are complicated, noisy and hard to use will be ignored.
We’ve brought together a showcase of innovative, stunningly beautiful dashboard concepts & designs to help inspire you. If you’re about to start a project that deals with data visualization, hopefully this collection will give you some inspiration into how you can show your information in a useful, simple and uncluttered way.
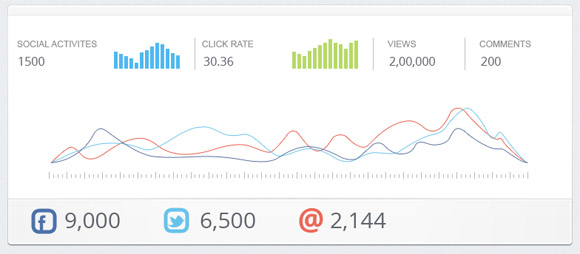
New Dashboard Line Graph
Chartbear Dashboard
Cutest Paw Dashboard
Minimal Dashboard
Dashboard Activity Section
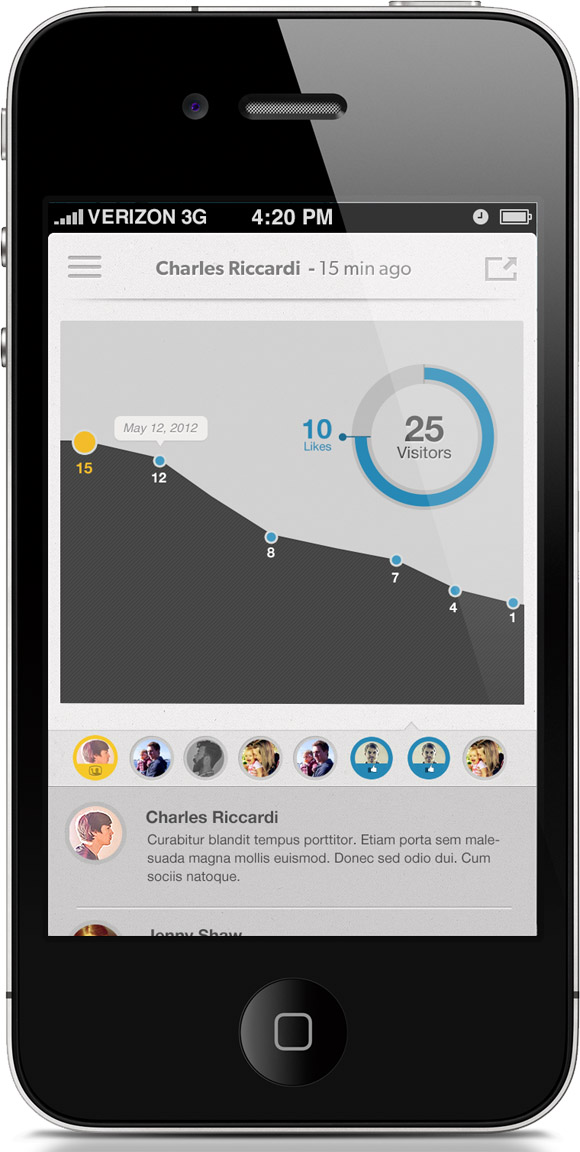
In App Visual Data
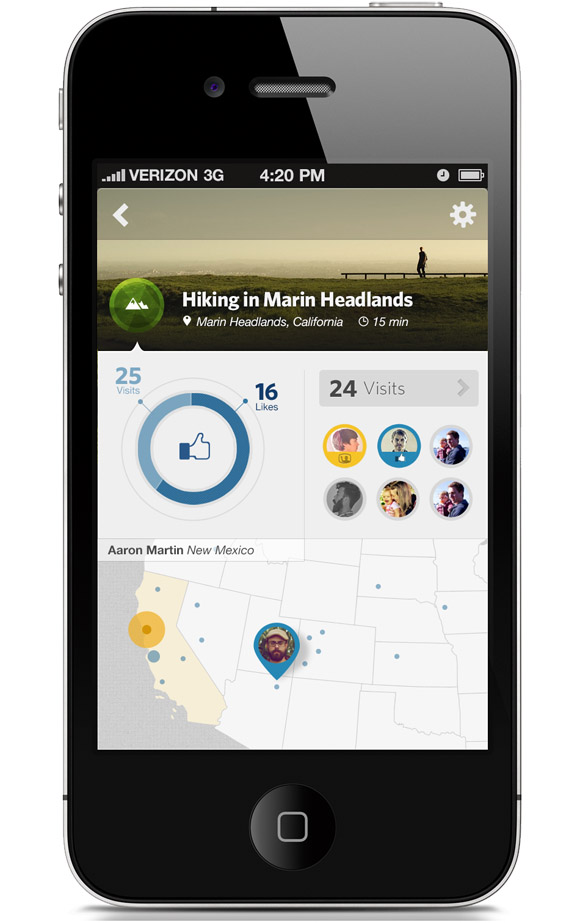
Visual Stats
Post Broadcast Info
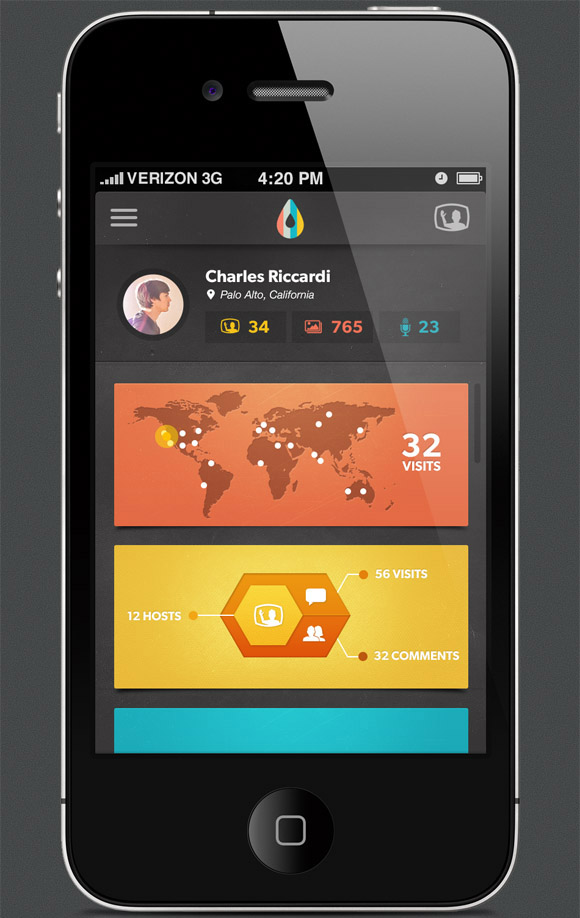
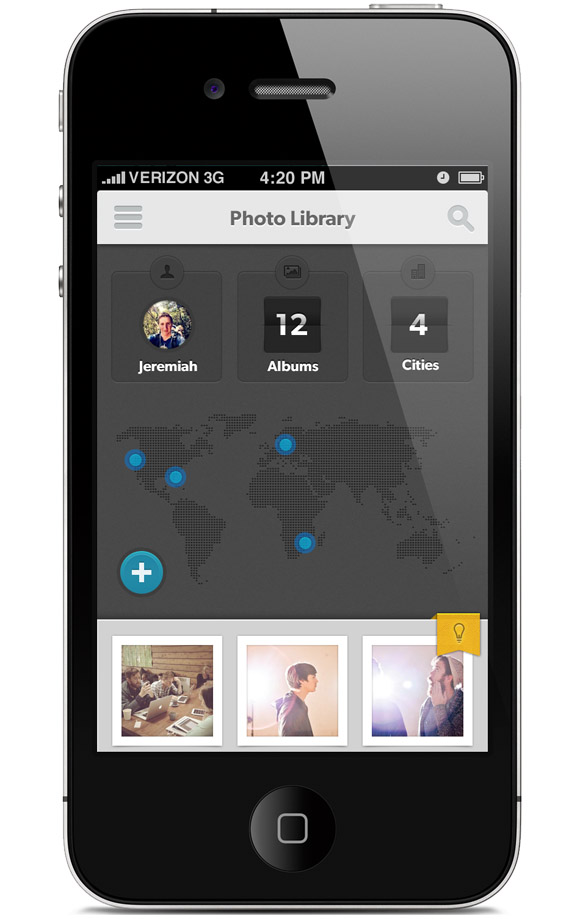
Dark Map Data
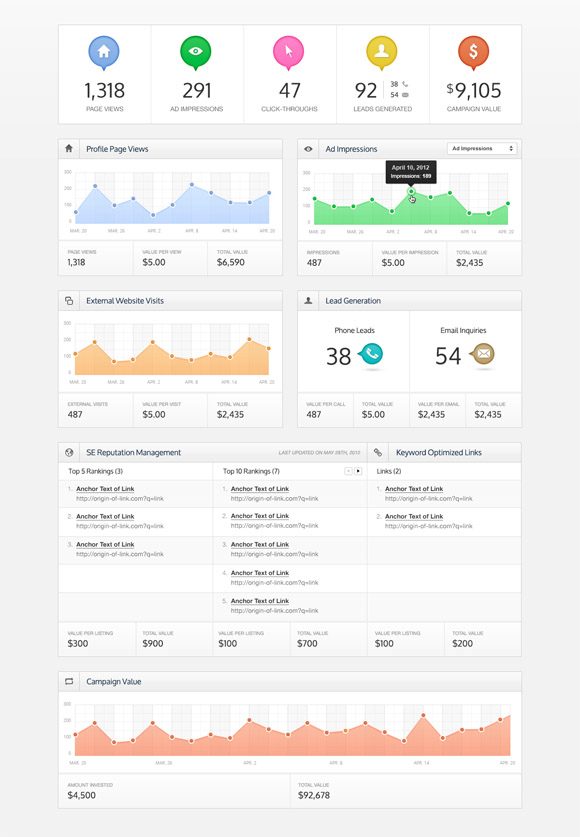
Dashboard Metrics
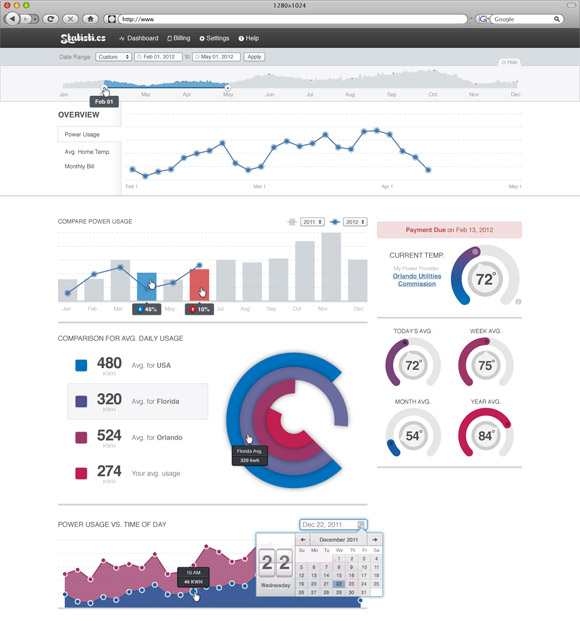
Home Statistics Dashboard
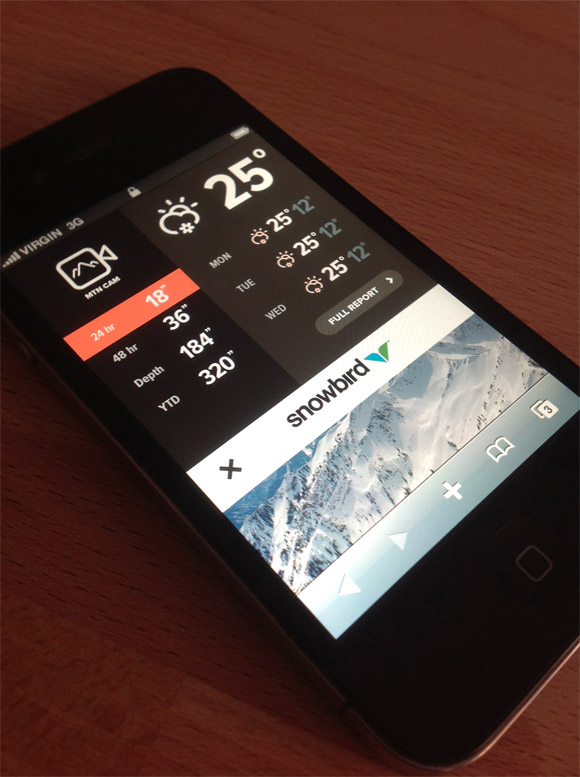
Weather Dashboard
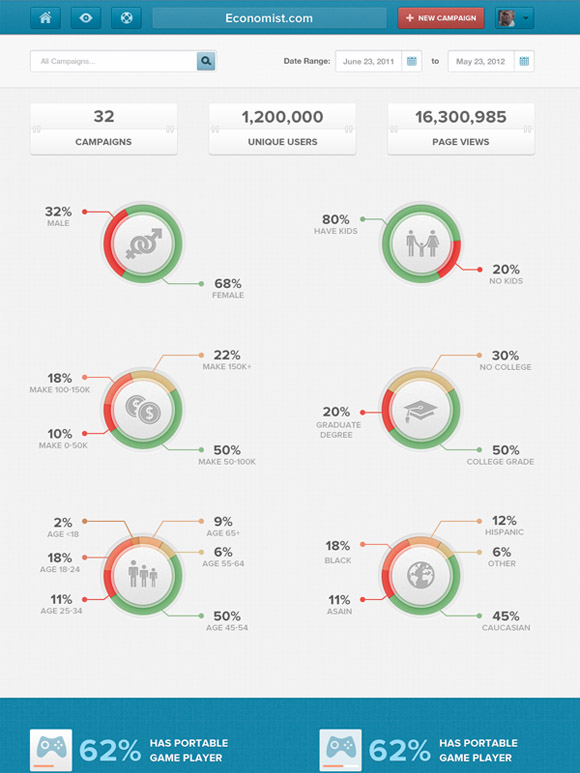
Economist Dashboard Design
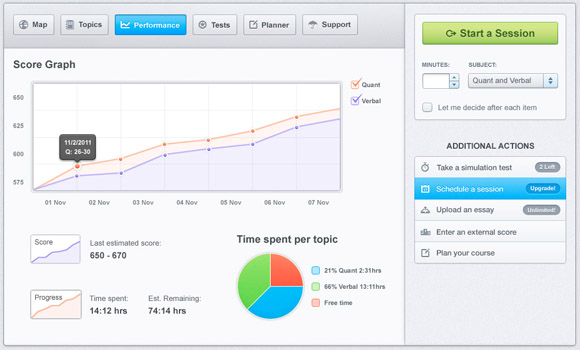
Dashboard Performance
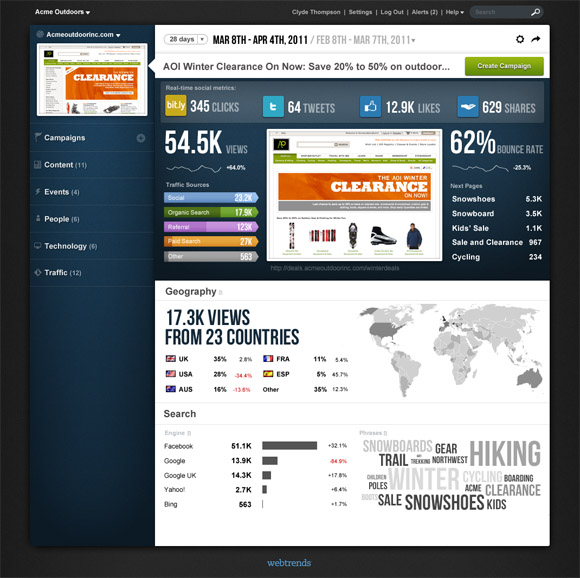
Webtrends Analytics 10 Dashboard
About the Author
Alex writes for Print Express, a printing company that specialises in business cards, posters & postcards. In his spare time he studies graphic and web design, and enjoys learning to code.


